Research Paper
Understanding Downside Risk: The Blended Portfolio Framework
Combining Cross-Asset Risk Parity with Equity Momentum via Dynamic Regime Allocation
What is downside risk?
Downside risk is the possibility that a portfolio falls in value, and how far it could fall before it recovers. Approaches that seek to manage downside risk involve trade-offs, such as giving up some potential gains, and none can eliminate losses. Principal can still decline in any market.
What questions can retirees ask about downside risk?
Downside risk affects people differently depending on when they need to draw on their savings. The questions below are educational prompts for a planning conversation. They are not recommendations, and the answers depend on individual circumstances.
- Withdrawal needs: How much of your income comes from your portfolio, and what may happen to those withdrawals if values decline early in retirement? Selling assets after a decline to fund spending can make a drawdown harder to recover from.
- Volatility: How much short-term change in account values can you and your household tolerate without changing your plan at an inopportune time? Lower volatility can come with trade-offs, including lower potential growth.
- Time horizon: When will you need the money, and for what? Funds needed in a few years and funds intended for later generations may call for different considerations.
Working through these questions often starts with seeing the whole financial picture. Acanto's Asset-Map® discovery process is designed to help organize accounts, income sources, and goals in one view, and the firm's financial planning services describe how withdrawal, risk, and time horizon questions may be considered together. The research below shows one framework's approach to drawdowns. It is not a recommendation for any investor, and losses remain possible.
"The goal of investing is not to maximize return. It is to maximize the probability of achieving your financial objectives without catastrophic loss along the way."
1. Why This Matters
Most investors are told that drawdowns are temporary — that markets always recover and patience is rewarded. What they are not told is how long that recovery takes, what happens to their standard of living during the wait, and how inflation silently compounds the damage while they sit underwater.
An investor who retired in 2000 with a balanced portfolio experienced three major drawdowns in twenty-two years. Each time, the conventional advice was to "stay the course." But for someone withdrawing 4% annually — a rate that becomes 6% or more when food, energy, and healthcare inflation are honestly accounted for — staying the course means selling assets at depressed prices to fund living expenses.
The math is unforgiving: a 50% drawdown requires a 100% gain just to break even, and that gain must occur while the investor is simultaneously liquidating shares.
2. The Two Strategies
2.1 Adaptive 8A — Cross-Asset Momentum with Risk Parity
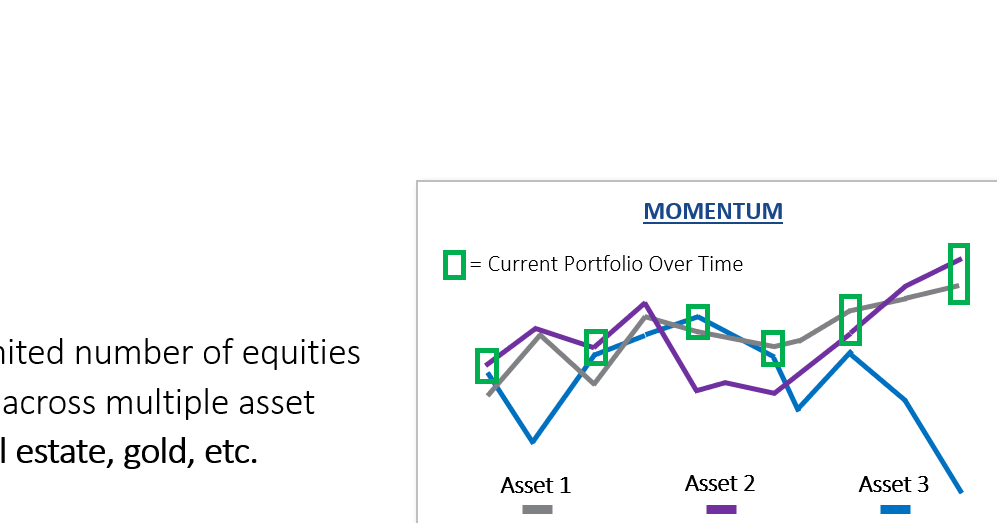
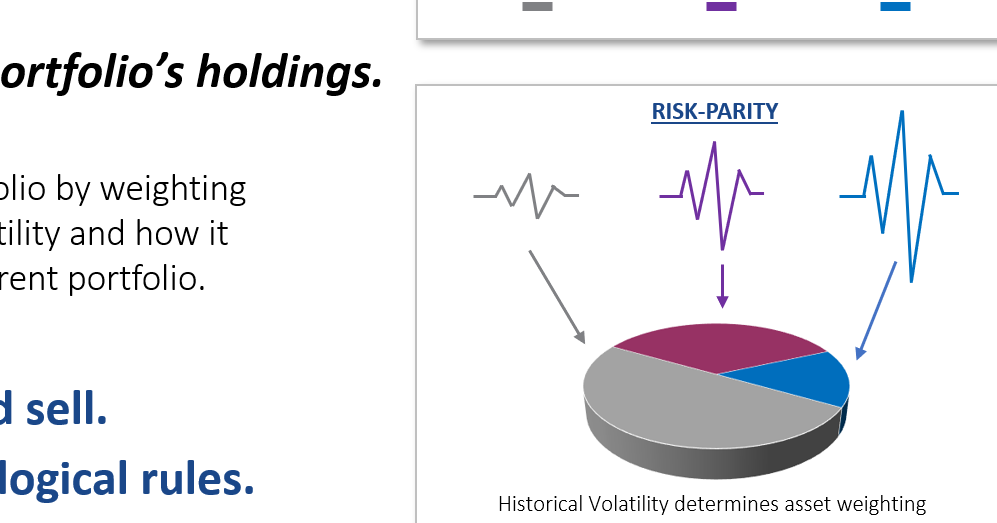
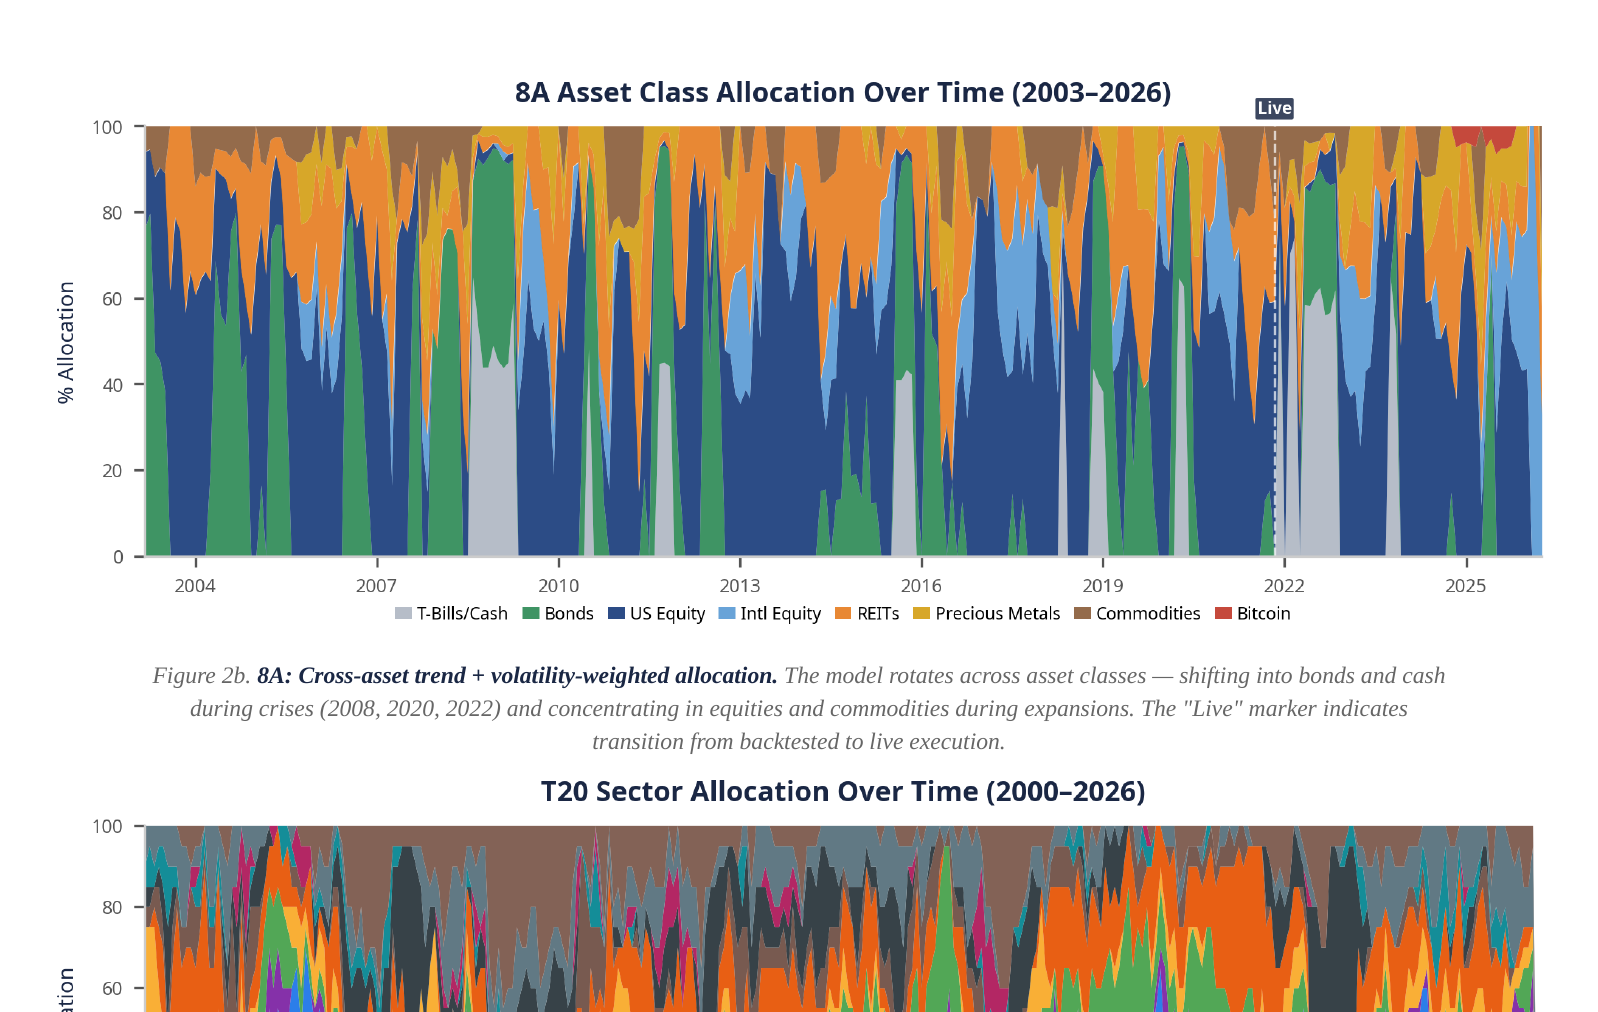
The Adaptive 8A strategy selects the top 8 assets from a diversified universe of 22 ETFs spanning U.S. equities, international equities, bonds, commodities, and real estate. Selection is based on 3–6 month price momentum. Position sizes are determined by inverse volatility weighting (risk parity): lower-volatility assets receive larger allocations, creating a naturally risk-balanced portfolio.
When market conditions deteriorate, the strategy shifts defensively into bonds, cash equivalents, and low-volatility assets. This adaptive behavior has historically limited drawdowns to approximately 10–11% even during periods when the S&P 500 declined by more than 50%.
2.2 T20 — Equity Momentum (Top 20 Stocks)
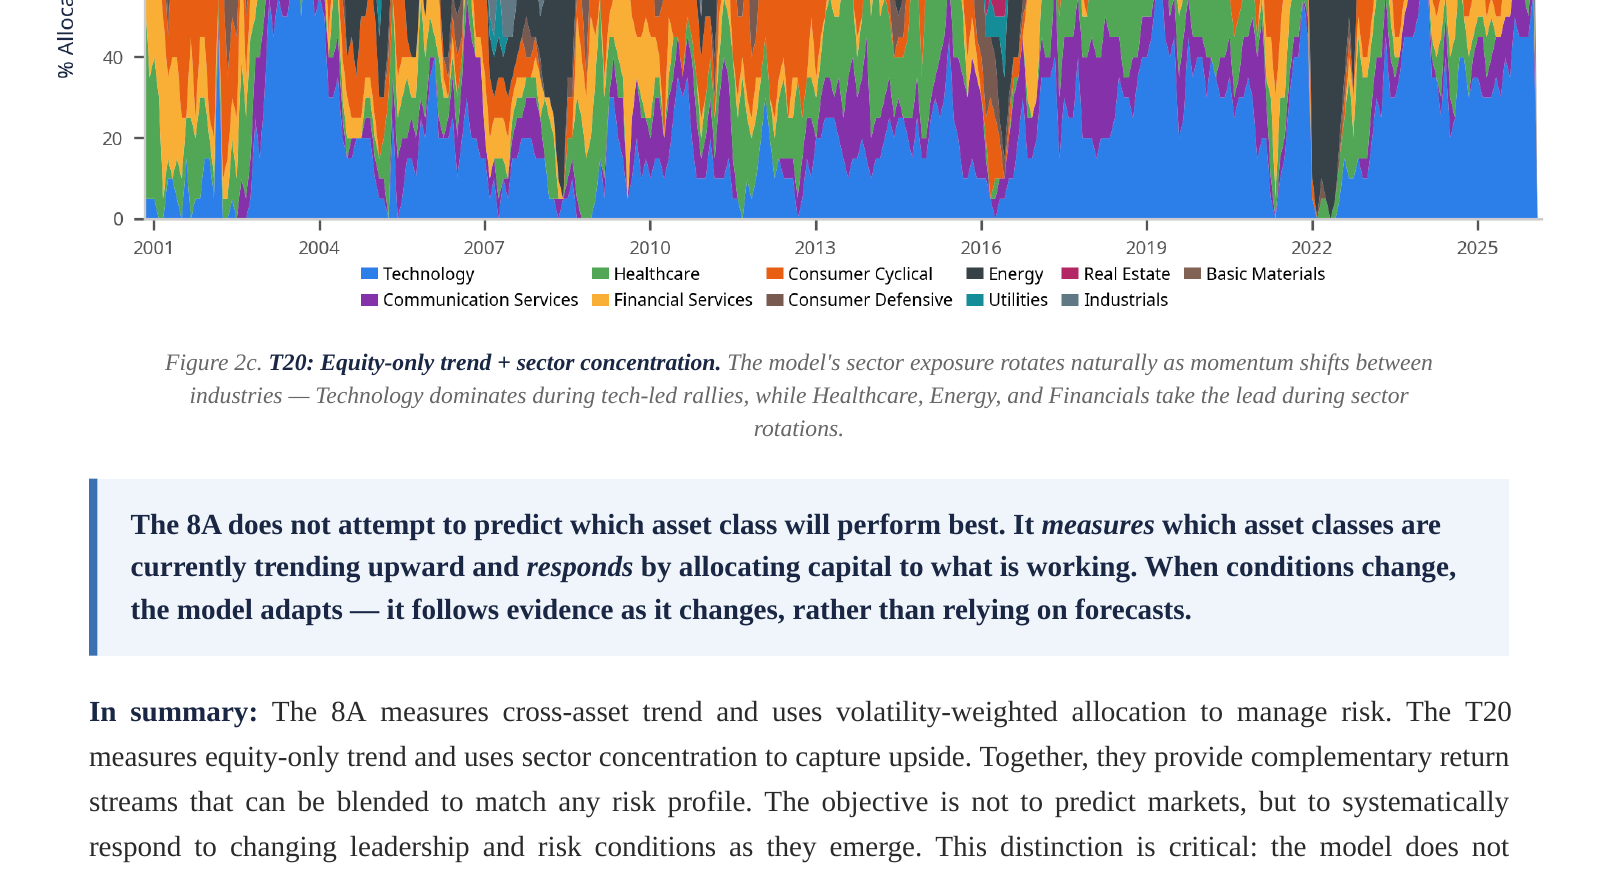
The T20 strategy applies the same momentum principle within the equity market. It ranks all stocks in the largest 1,000 global equities traded in the U.S. by price momentum and concentrates capital in the 20 strongest-trending names. Unlike the 8A, the T20 does not rotate into defensive asset classes — it is a pure equity strategy that participates aggressively in bull markets.
3. Why They Work Together
The 8A profits from cross-asset momentum and volatility management. Its primary strength is drawdown protection: when equities collapse, it rotates into bonds or cash. Its primary limitation is that during strong equity bull markets, it may underperform a fully-invested stock portfolio.
The T20 profits from within-equity momentum. Its primary strength is upside capture: during bull markets, it delivers returns well above the broad market. Its primary limitation is that it offers no protection during equity bear markets.
When equities are rising strongly, T20 contributes outsized returns while 8A provides a stable base. When equities falter, 8A rotates to bonds, commodities, or cash and limits the damage — while T20's losses are diluted by the 8A's defensive positioning.
4. The Full Spectrum: Fixed Blends
| Blend | CAGR | Sharpe | Sortino | Max DD | Vol |
|---|---|---|---|---|---|
| 100% 8A (Conservative) | 10.47% | 0.82 | 1.37 | -11.3% | 10.4% |
| 80/20 (8A/T20) | 12.09% | 0.79 | 1.28 | -19.8% | 12.7% |
| 70/30 | 12.88% | 0.76 | 1.21 | -24.8% | 14.3% |
| 60/40 | 13.22% | 0.70 | 1.11 | -29.8% | 16.0% |
| 50/50 | 13.50% | 0.64 | 1.01 | -34.8% | 17.8% |
| 20/80 (Growth) | 13.96% | 0.50 | 0.77 | -49.7% | 23.5% |
| 100% T20 (Aggressive) | 14.06% | 0.40 | 0.62 | -61.7% | 30.1% |
| Benchmark | CAGR | Sharpe | Max DD | Vol |
|---|---|---|---|---|
| S&P 500 (SPY) | 11.33% | 0.54 | -51.5% | 17.3% |
| 60/40 (SPY/AGG) | 7.91% | 0.78 | -30.0% | 10.6% |
5. The Dynamic Approach: Regime-Switching Blends
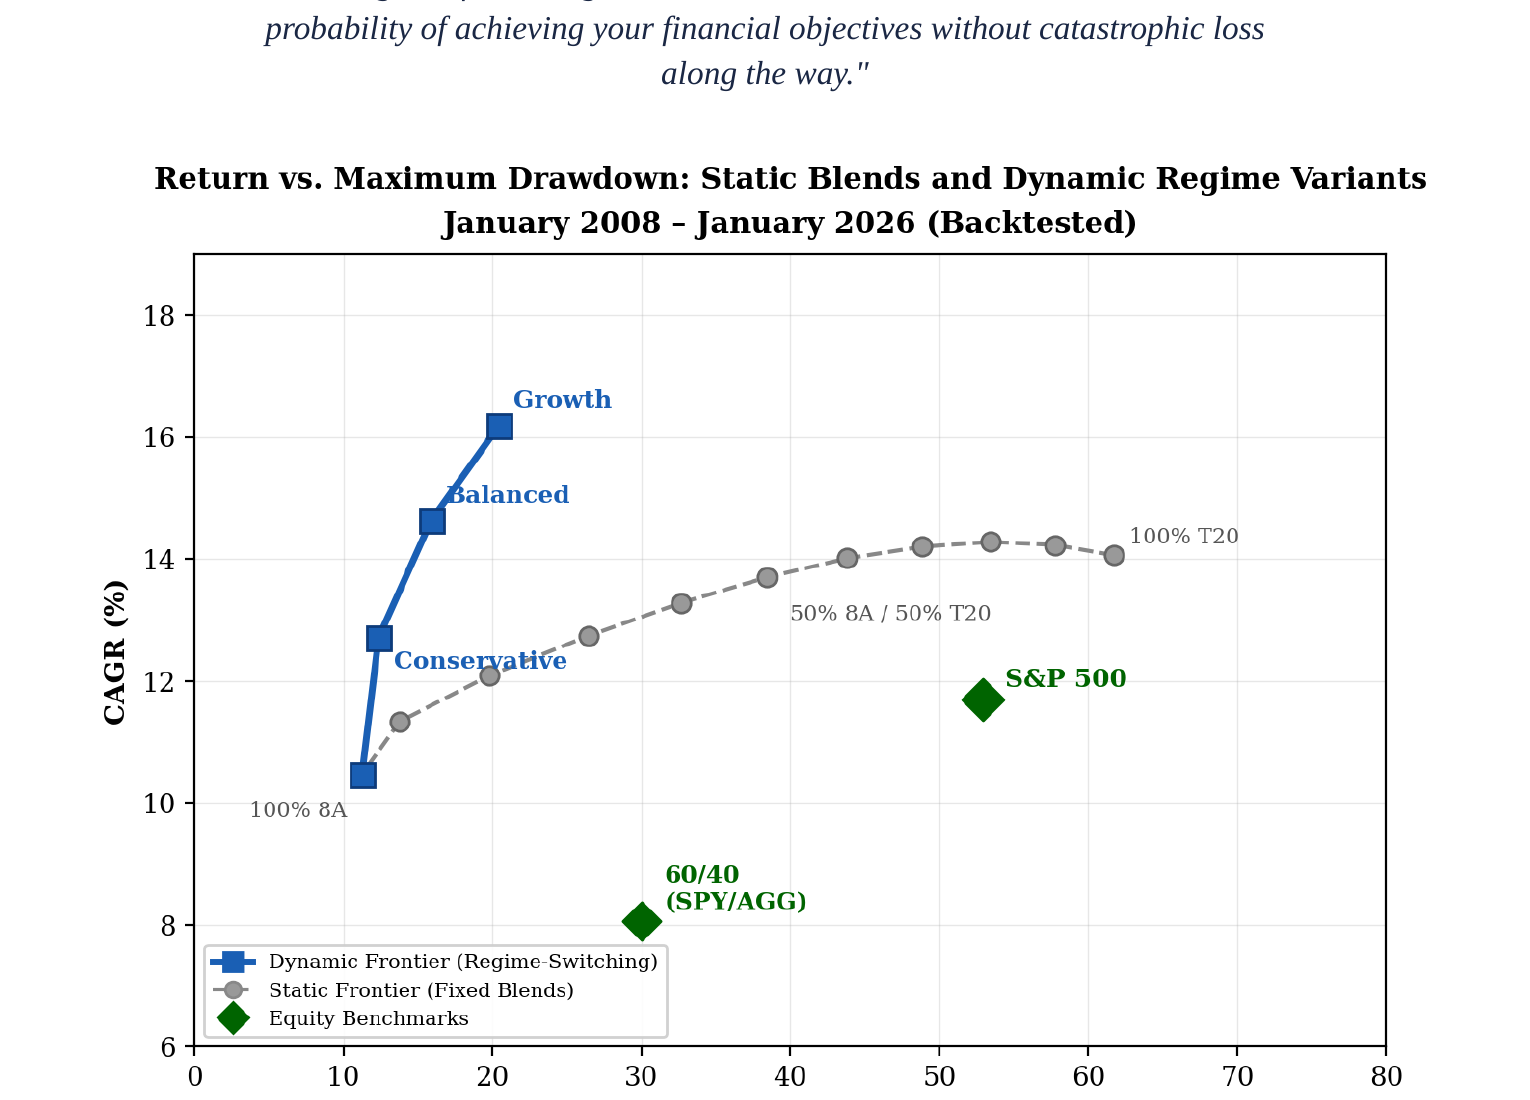
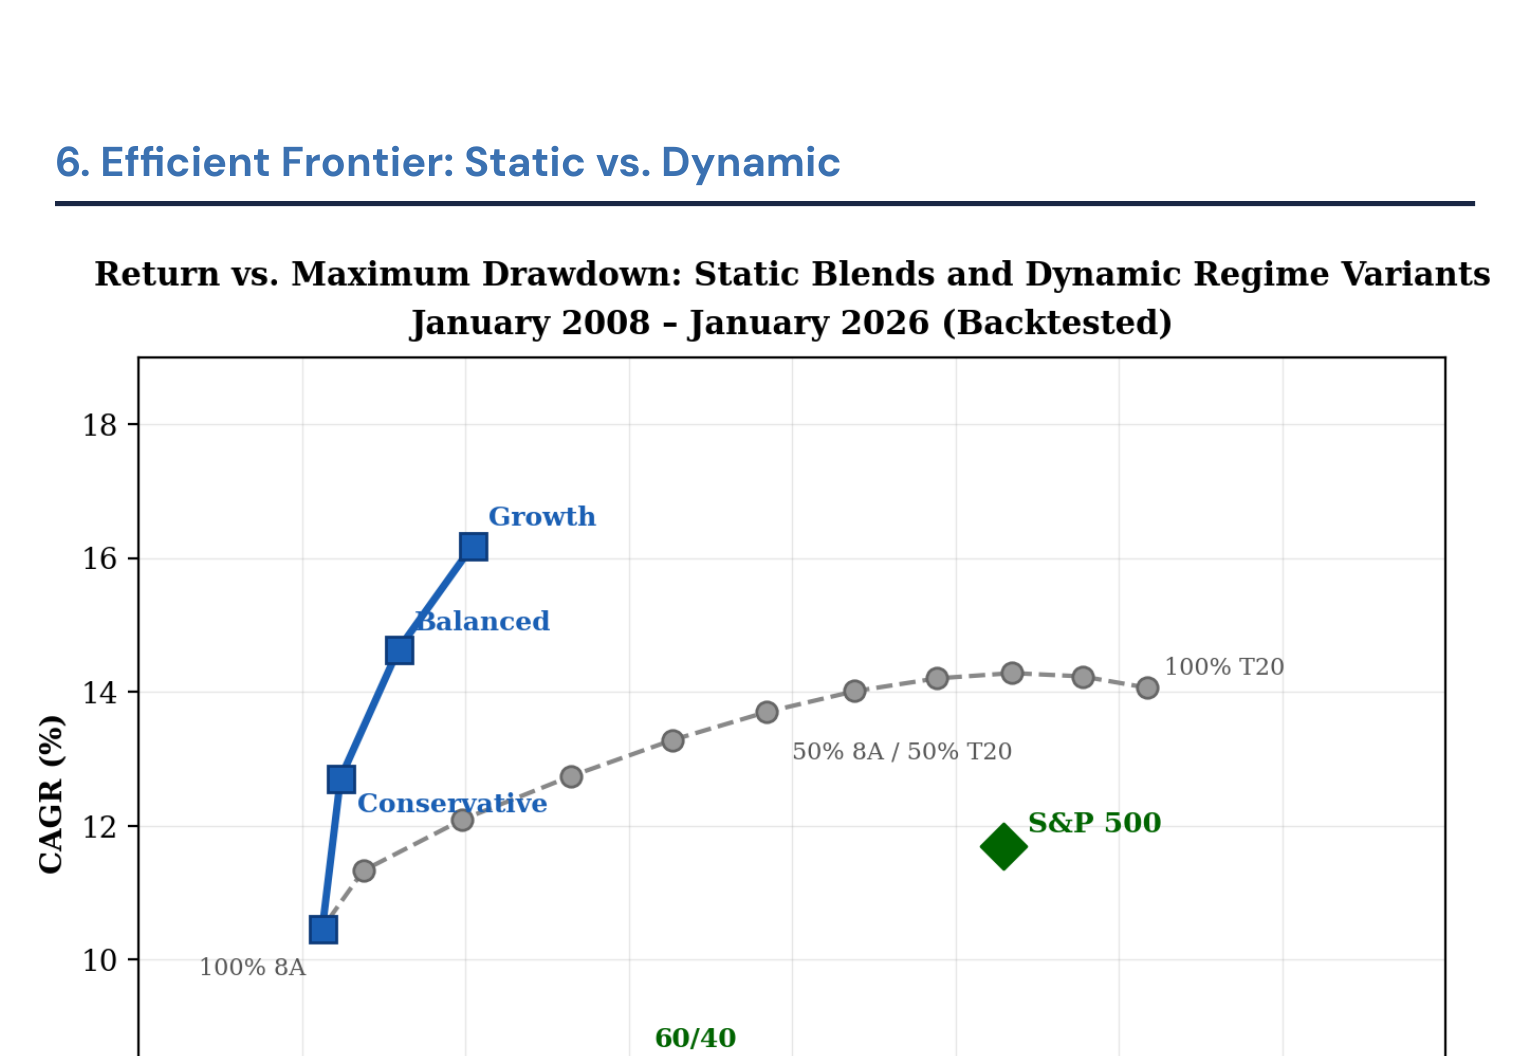
The fixed blends maintain a constant allocation regardless of market conditions. The dynamic approach goes further: it uses the 8A model's own behavior as a regime signal. When the 8A is fully invested in non-cash assets, conditions are favorable — the portfolio runs the blended strategy for growth. When the 8A begins shifting to cash and bonds, the portfolio moves entirely to the defensive 8A sleeve to protect capital.
Adaptive Regime Switching
Blended 8A + T20 portfolio runs for growth when the 8A model's non-cash allocation indicates favorable conditions.
The 8A model's own non-cash allocation serves as the regime measurement. It responds to observed conditions — not a market prediction.
Portfolio shifts entirely to the defensive 8A sleeve (bonds, cash, low-volatility assets) when the threshold condition is met.
| Risk-On Blend | CAGR | Sharpe | Sortino | Max DD | Vol |
|---|---|---|---|---|---|
| Conservative (0% T20) | 10.47% | 0.82 | 1.37 | -11.3% | 10.4% |
| Best Risk-Adjusted (20% T20) | 12.72% | 1.12 | 1.93 | -11.2% | 9.6% |
| Balanced (40% T20) | 14.65% | 1.06 | 1.81 | -15.2% | 12.0% |
| Growth (60% T20) | 16.23% | 0.88 | 1.49 | -19.5% | 16.1% |
The dynamic "Best Risk-Adjusted" variant earned 12.72% annualized with a maximum drawdown of -11.2%, compared to the S&P 500's 11.33% return with -51.5% drawdown.
6. Efficient Frontier: Static vs. Dynamic
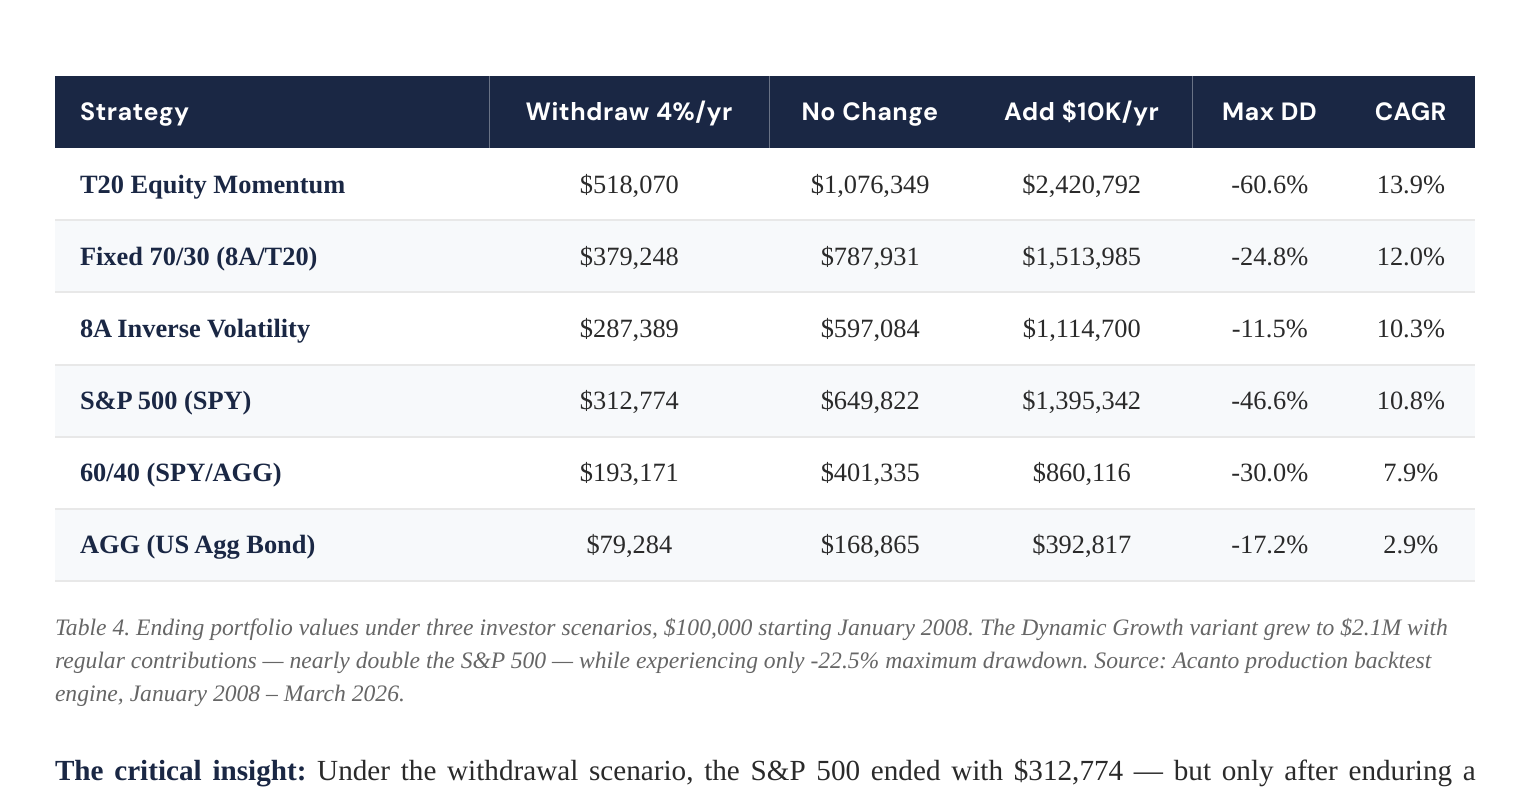
7. Real-World Impact: Three Investor Scenarios
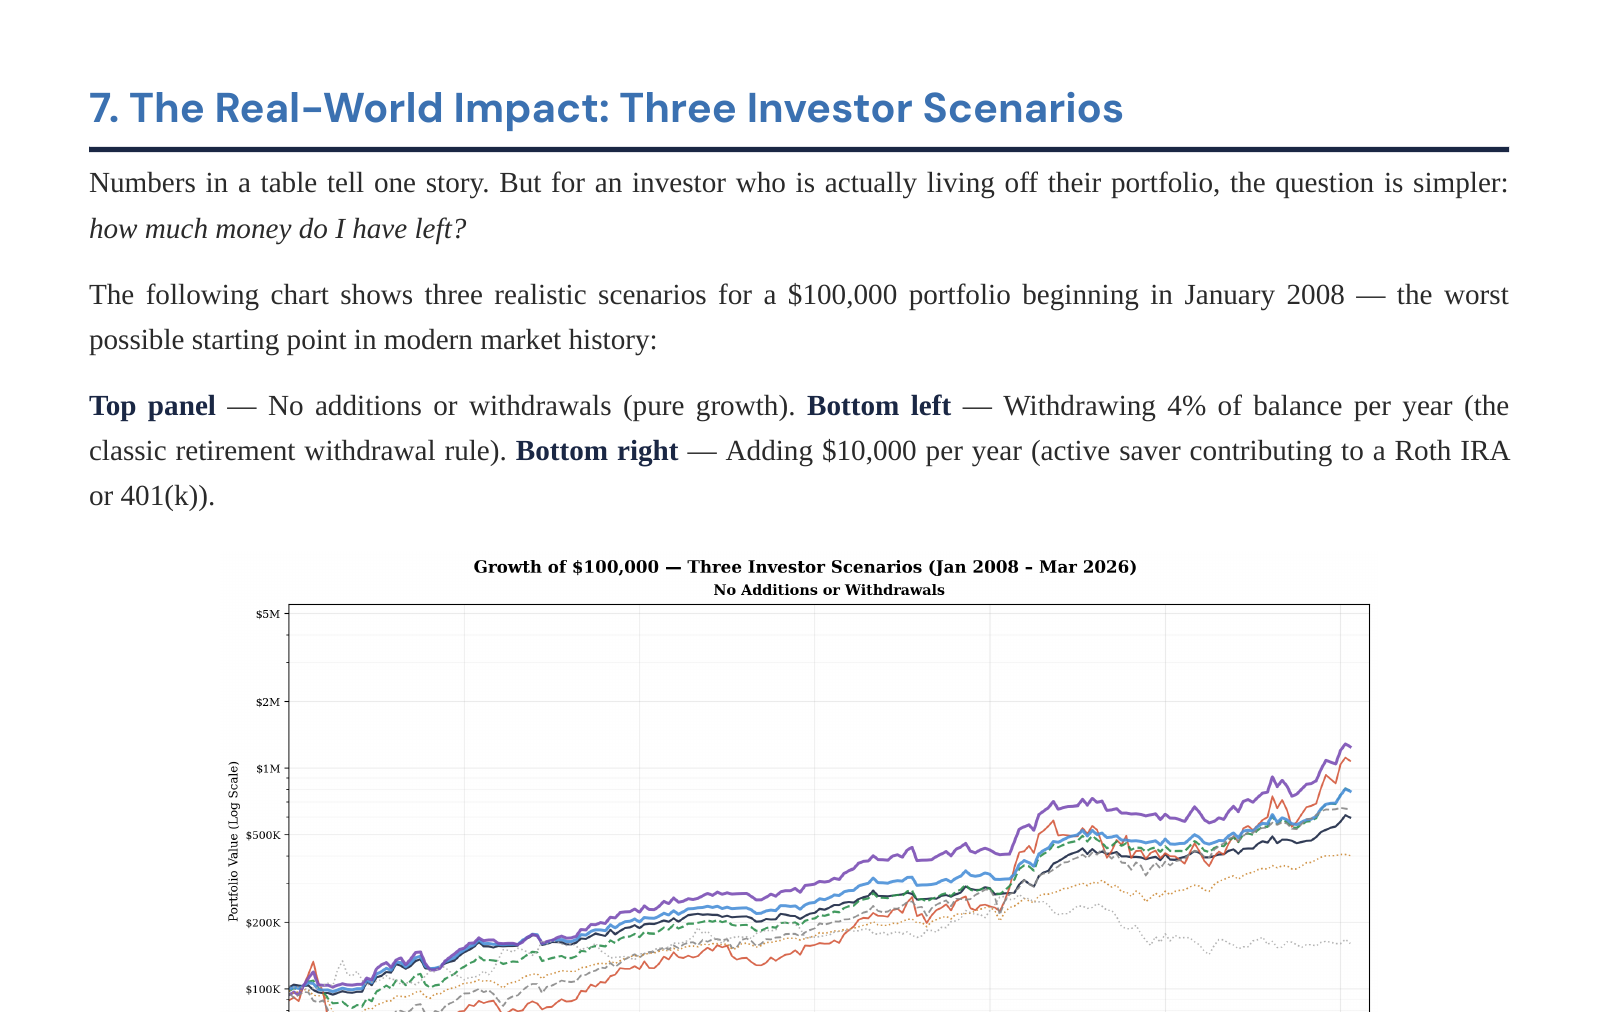
| Strategy | 4% Withdrawal | No Change | Add $10K/yr | Max DD |
|---|---|---|---|---|
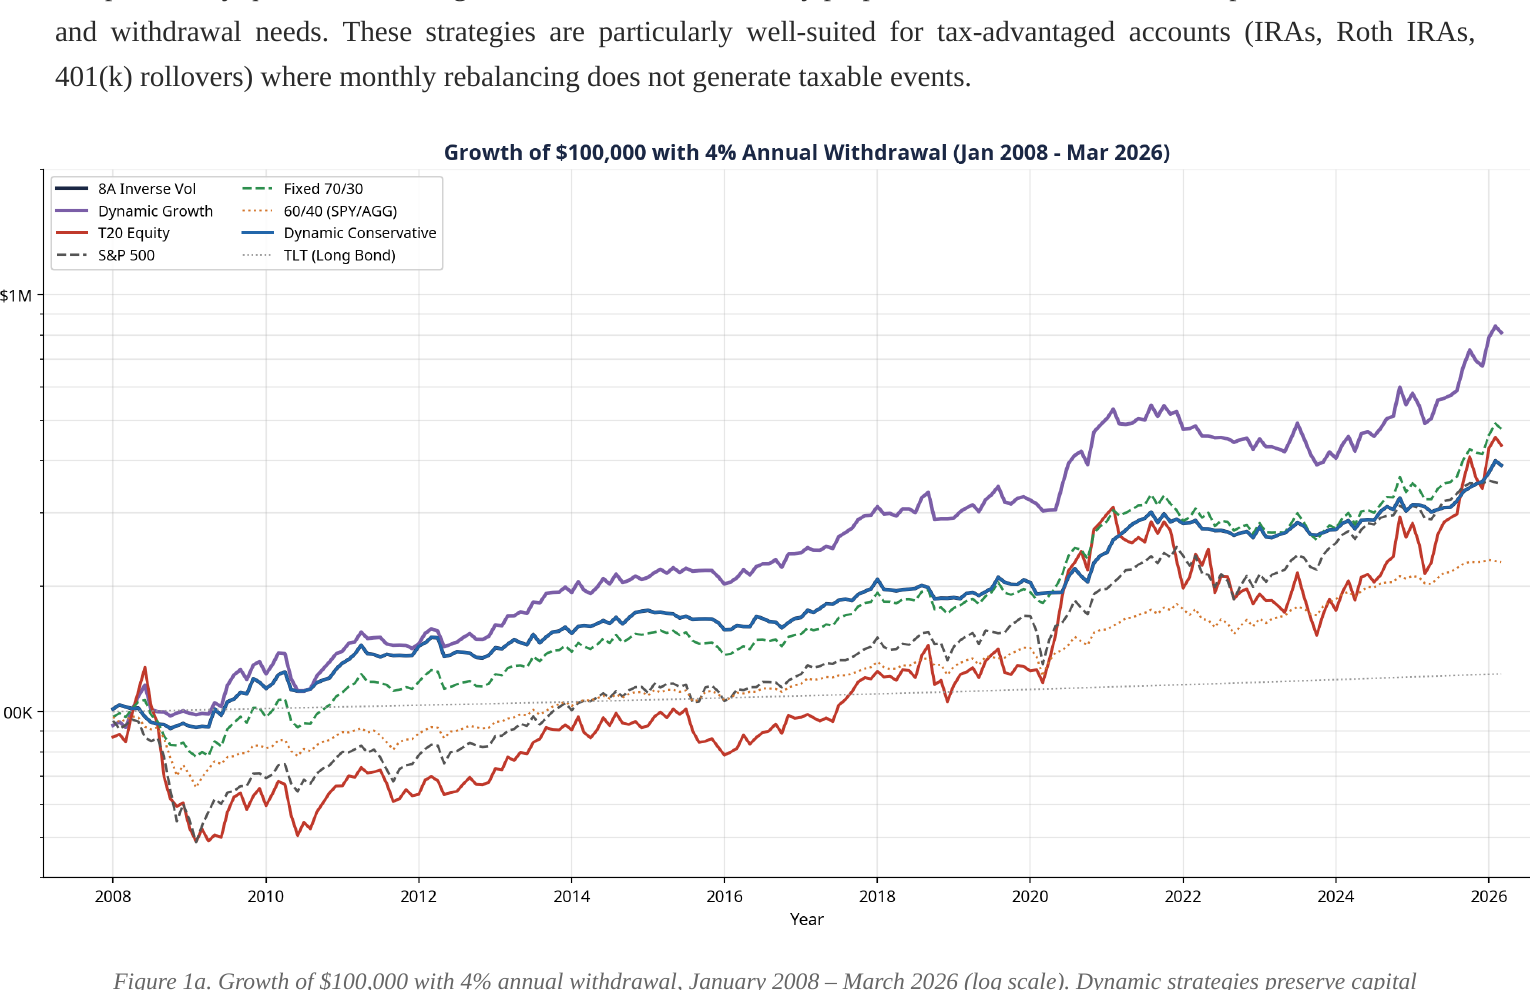
| Dynamic Growth (40/60) | $600,715 | $1,248,053 | $2,141,023 | -22.5% |
| Dynamic Conservative (80/20) | $377,253 | $783,785 | $1,412,848 | -14.0% |
| S&P 500 (SPY) | $312,774 | $649,822 | $1,395,342 | -46.6% |
| 60/40 (SPY/AGG) | $193,171 | $401,335 | $860,116 | -30.0% |
| AGG (US Agg Bond) | $79,284 | $168,865 | $392,817 | -17.2% |
8. How the Regime Signal Works
The signal is not intended to forecast markets — it is designed to measure deteriorating conditions in real time. When the 8A model's own momentum and volatility filters cause it to shift heavily into cash and bonds, that behavior itself indicates deteriorating market conditions.
9. Best Suited for Tax-Advantaged Accounts
Both strategies rebalance monthly, which generates significant short-term capital gains in taxable accounts. These strategies are generally most appropriate for tax-qualified accounts:
- Traditional IRAs and IRA Rollovers— Taxes are deferred until withdrawal.
- Roth IRAs and Roth Conversions— Qualified withdrawals are entirely tax-free, making Roth accounts ideal for higher-return strategies.
- 401(k) and 403(b) Plans— Where self-directed brokerage options are available.
10. Extended Backtesting: 154 Years of Evidence
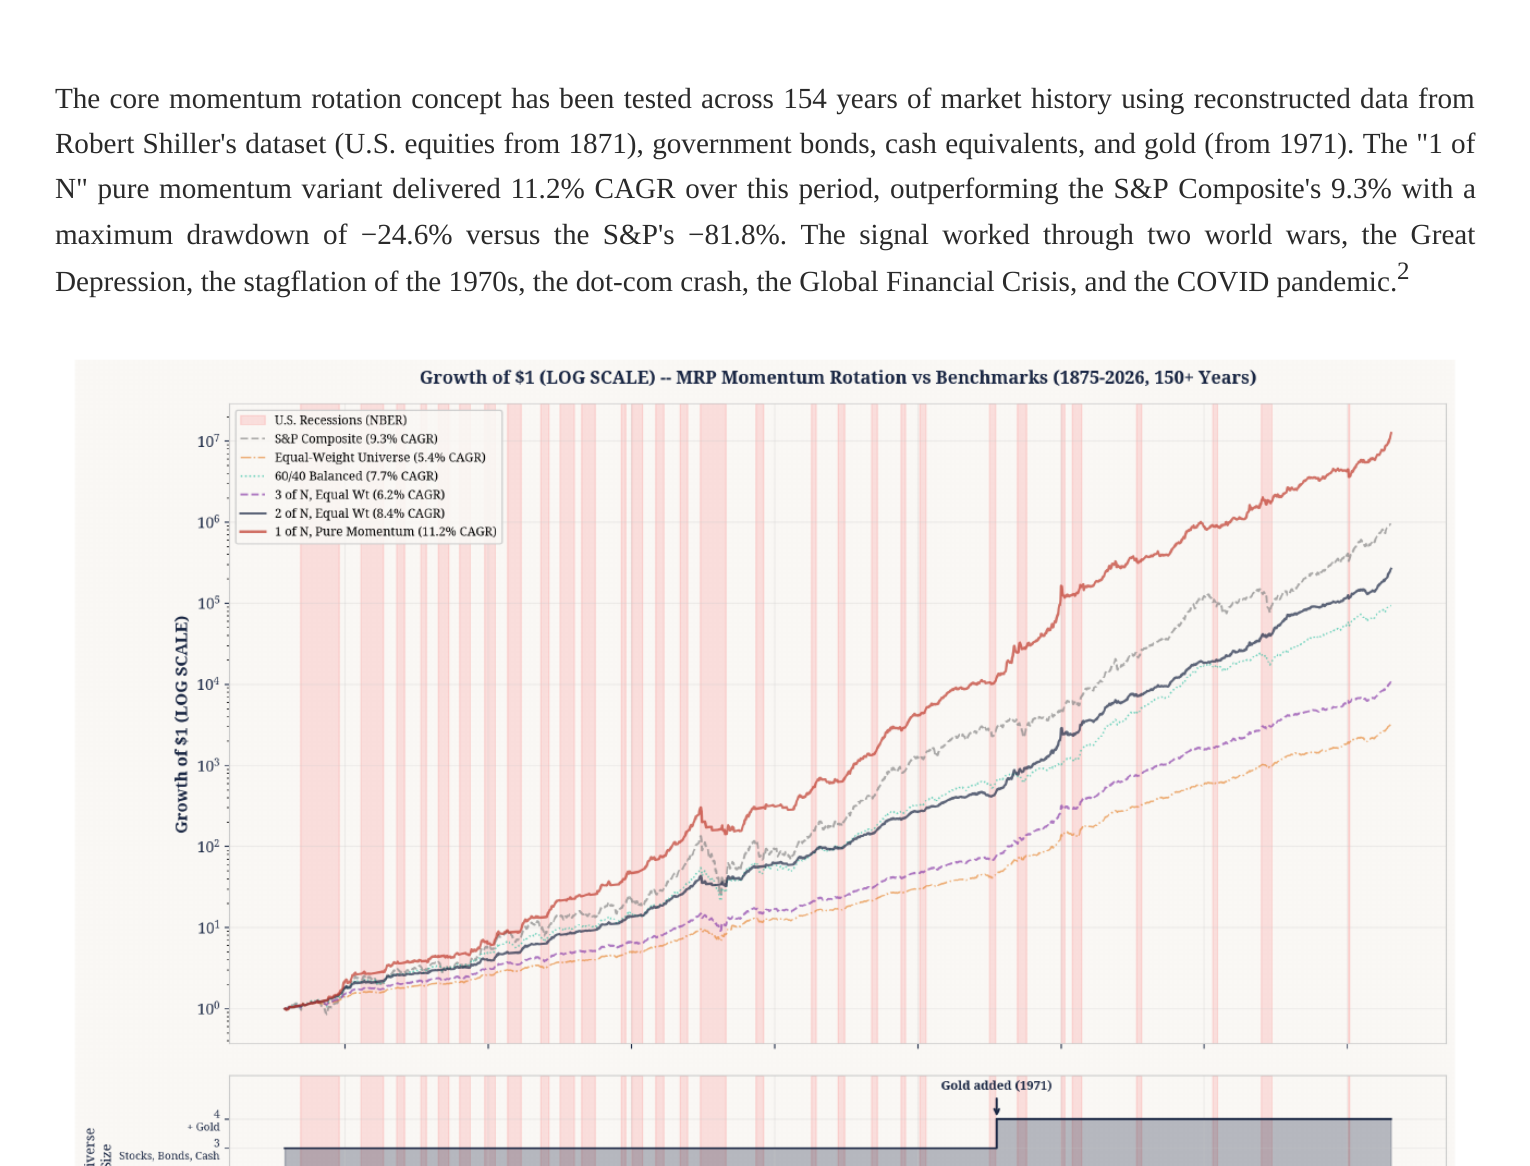
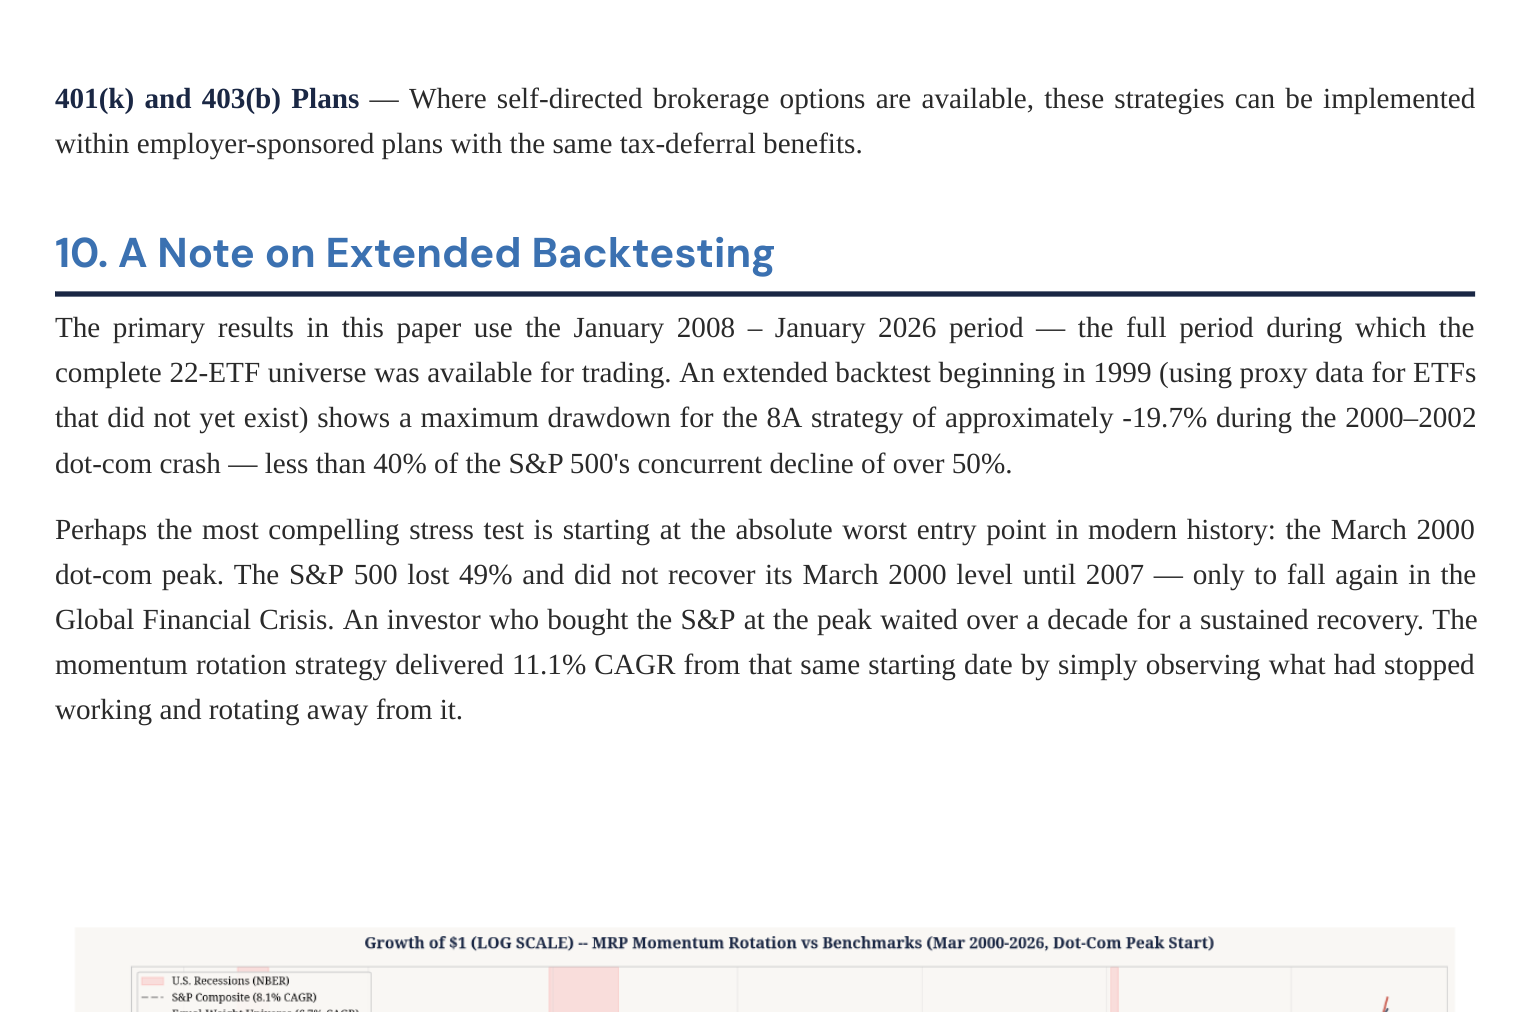
The core momentum rotation concept has been tested across 154 years of market history using reconstructed data from Robert Shiller's dataset (U.S. equities from 1871), government bonds, cash equivalents, and gold (from 1971). The "1 of N" pure momentum variant delivered 11.2% CAGR over this period, outperforming the S&P Composite's 9.3% with a maximum drawdown of −24.6% versus the S&P's −81.8%.
References
- Lusk, P. (2026).Persistent Coincidental Prediction: Momentum Signals Across 154 Years of Market Data.Acanto LLC Research Paper.
- Lusk, P. (2026).Equity Momentum Unpacked: A Systematic Framework for U.S. Stock Selection.Acanto LLC Research Paper.
- Maillard, S., Roncalli, T., and Teïletche, J. (2010). "The Properties of Equally Weighted Risk Contribution Portfolios."The Journal of Portfolio Management, 36(4), 60–70.
- Jegadeesh, N. and Titman, S. (1993). "Returns to Buying Winners and Selling Losers."The Journal of Finance, 48(1), 65–91.
Download the full research paper:Blending Dynamic Strategies to Reduce Drawdown and Improve Returns.
Download PDFImportant Research Disclosures and Risk Information
This paper is intended solely for informational, educational, and research purposes. It does not constitute investment advice, a solicitation, or an offer to buy or sell any security or investment product. Any solicitation of investment management services by Acanto, LLC is valid only when accompanied by a current Form ADV Part 2 or equivalent regulatory disclosure document.
All performance data presented, including backtested results, hypothetical results, and live performance results, are provided for informational purposes only. Past performance is not a guarantee, prediction, or indication of future results. An investor may experience a loss of some or all of the principal invested.
Backtested performance results have inherent limitations and are hypothetical in nature. They do not reflect the impact of material economic and market factors that may have affected decision-making if the advisor had actually managed client assets during the period shown. Backtested results assume no transaction costs, no slippage, no market impact, and no taxes unless otherwise stated.
The strategies described involve concentrated equity positions and monthly rebalancing. The equity momentum component may hold concentrated positions in individual stocks, which increases volatility relative to a broadly diversified portfolio. These strategies are generally most appropriate for tax-qualified accounts such as IRAs, 401(k)s, and Roth IRAs.
The investment strategies described herein may be modified, adjusted, or discontinued at any time at the discretion of the advisor. Acanto, LLC is a registered investment advisor. Registration does not imply a certain level of skill or training.
All investing involves risk, including the possible loss of principal. Past performance is no guarantee of future results.
© 2026 Acanto, LLC. All rights reserved.
Related Research
Better strategy starts with clarity.
Financial decisions should not be made in isolation. Acanto coordinates account structure, cash flow, taxes, insurance, estate planning, and adaptive investment management within one financial picture.
Continue the planning conversation
Explore Acanto's financial planning services and investment strategies to see how planning and portfolio decisions may be considered together for your individual circumstances.