Research Paper
Persistent Coincidental Prediction
A Non-Predictive Framework for Mitigating Sequence of Returns Risk Through Cross-Asset Momentum Rotation
Why This Matters
Most investors have no alternative. Pensions are disappearing. Annuities are expensive and inflexible. Real estate is illiquid. For most families, the capital markets are the only engine they have — and if that engine fails during the withdrawal years, there is no second chance.
Retiring and worrying about markets rolling over and taking a 50% drawdown is not a way to enjoy retirement. But if you can limit that to 10–15% drawdown — no guarantees — and still participate in the upside across multiple asset classes, you have a fundamentally different relationship with your portfolio. You do not have to hang out waiting for gold to react for 20 years, or pray that bonds recover from a rate shock, or hope that U.S. equities resume their leadership.
This paper asks a simple question: can a rules-based process reduce the damage when markets fail, without requiring you to predict when they will?
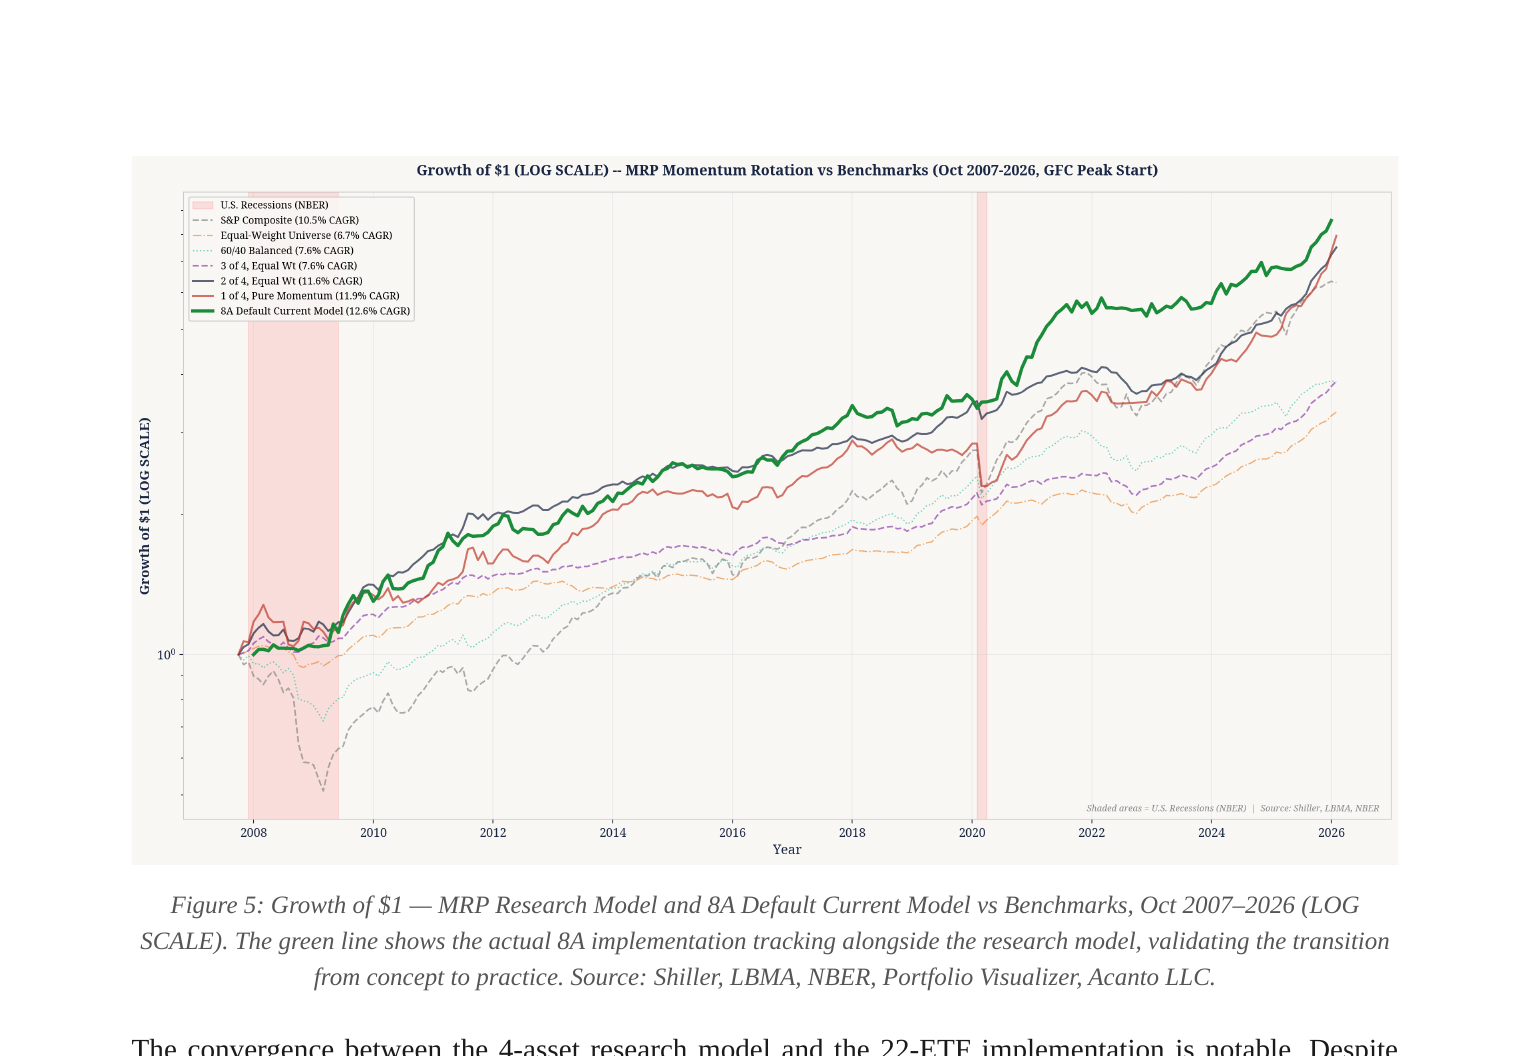
One hundred and fifty-four years of evidence — spanning two world wars, the Great Depression, stagflation, the dot-com crash, the Global Financial Crisis, and the COVID pandemic — suggest that it can. Not perfectly. Not without cost. But consistently enough to matter.
Abstract
This paper presents a rules-based cross-asset momentum rotation strategy tested across 154 years of market data (1871–2026). The strategy ranks a small universe of asset classes — U.S. equities, bonds, cash, and gold — by trailing 3–6 month returns and allocates capital to the strongest-performing assets. The framework requires no forecasting, no macroeconomic modeling, and no subjective judgment. It observes what is working and responds accordingly.
The Acanto 8A implementation extends this concept to a 22-ETF universe spanning eight asset classes, using risk parity weighting to balance risk contribution across holdings. Tested across 4,228 unique parameter combinations, the current configuration ranks in the 99th percentile for Sharpe Ratio and 2nd percentile for maximum drawdown — meaning it sits on the efficient frontier of all tested models.
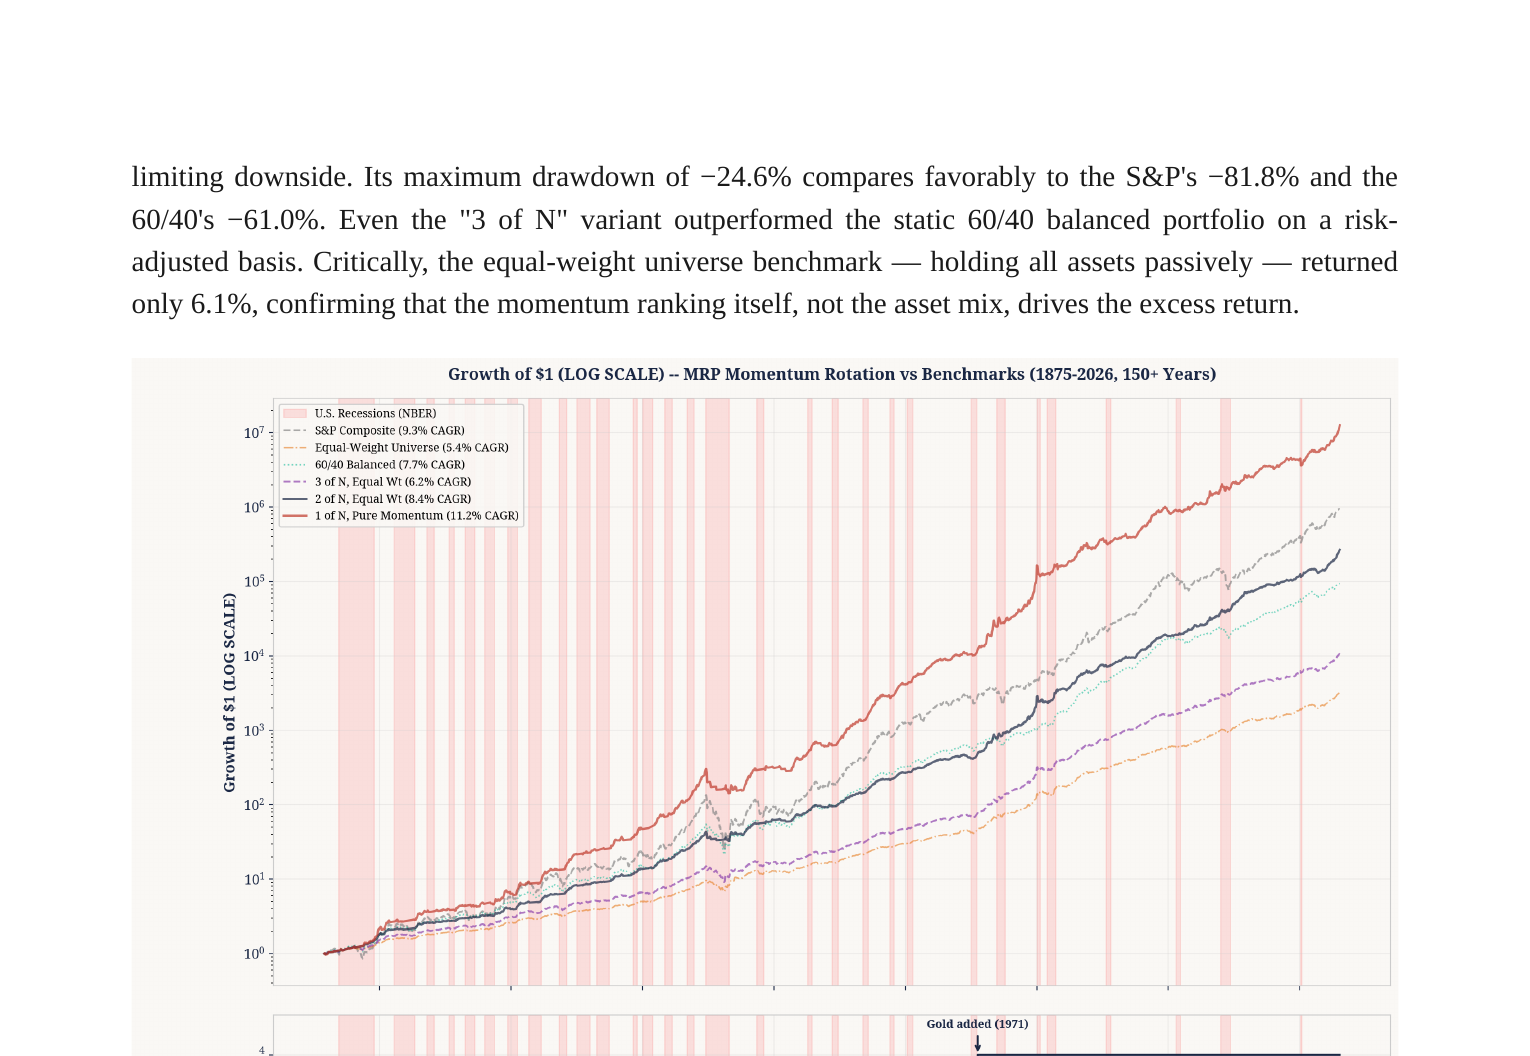
Core Results: 154-Year Asset-Class Test
| Variant | CAGR | Vol | Sharpe | Sortino | Max DD |
|---|---|---|---|---|---|
| 1 of N (Pure Momentum) | 11.2% | 11.4% | 0.72 | 0.79 | -52.9% |
| 2 of N (Best Risk-Adjusted) | 8.4% | 6.6% | 0.80 | 0.98 | -24.6% |
| 3 of N | 6.2% | 5.5% | 0.58 | 0.62 | -38.9% |
| S&P U.S. Equity Composite | 9.3% | 14.0% | 0.49 | 0.47 | -81.8% |
| 60/40 Balanced | 7.7% | 8.5% | 0.56 | 0.54 | -61.0% |
| Equal-Weight Universe | 6.1% | 5.1% | 0.59 | 0.61 | -38.0% |
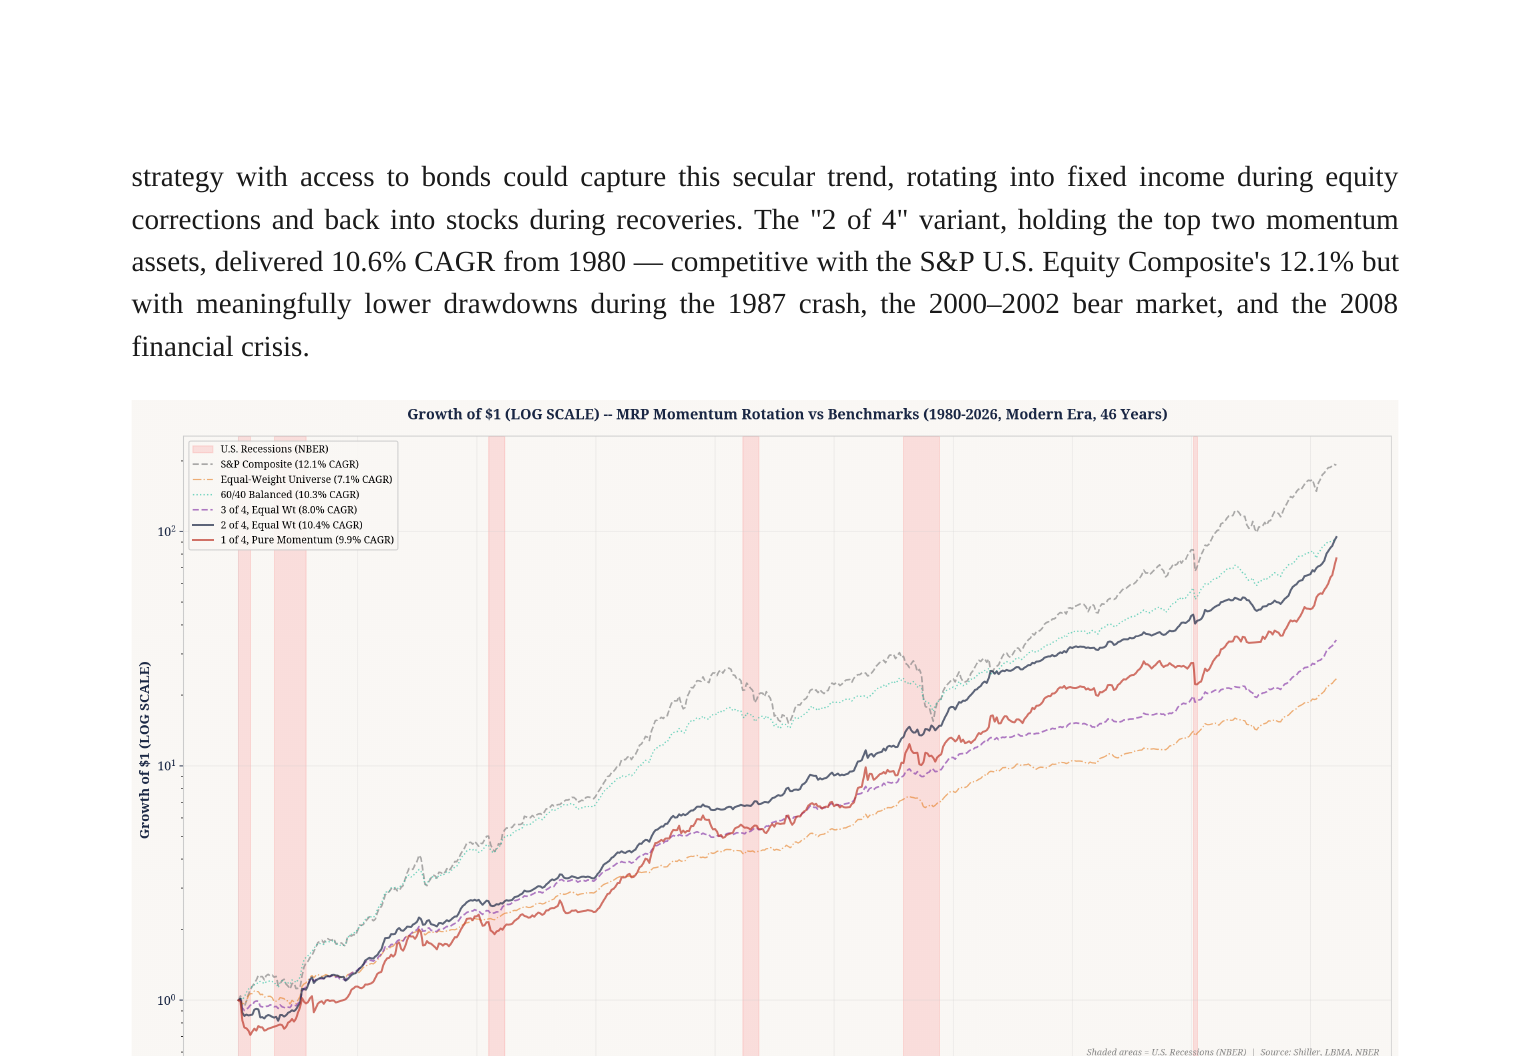
The "2 of N" variant — holding the top two momentum assets — achieved the highest risk-adjusted returns of any variant, with a Sharpe of 0.80 and Sortino of 0.98. Its maximum drawdown of −24.6% compares favorably to the S&P's −81.8% and the 60/40's −61.0%.
The 154-year test reveals the strategy's most important property: regime indifference. The momentum signal worked during the classical gold standard era, through two world wars, the Great Depression, stagflation, the secular bull market of 1982–2000, the dot-com crash, the Global Financial Crisis, and the COVID pandemic.
Stress Tests Across Starting Points
The 8A Implementation: 22 ETFs, 18 Years
The Acanto 8A strategy as currently implemented uses a universe of 22 exchange-traded funds spanning eight asset classes: U.S. equities (QQQ, SPY, DIA, MDY, VBR, VTI, XLF, XLE), international equities (VEU, VPL), fixed income (TLT, IEF, SHY, BIL), real assets (GLD, SLV, DBC), real estate investment trusts (AMT, PSA, EQIX, WELL), and select alternatives.
| Variant | CAGR | Vol | Sharpe | Sortino | Max DD |
|---|---|---|---|---|---|
| Top 6 Assets | 11.48% | 11.36% | 1.01 | 1.91 | -13.88% |
| Top 7 Assets | 11.49% | 10.84% | 1.06 | 2.03 | -11.07% |
| Top 8 Assets (Default) | 11.60% | 10.18% | 1.14 | 2.17 | -10.36% |
| Top 9 Assets | 11.07% | 9.70% | 1.14 | 2.19 | -8.17% |
| Average (6/7/8/9) | 11.43% | 10.37% | 1.10 | 2.10 | -10.44% |
| S&P 500 | 11.01% | 15.64% | 0.62 | — | -46.33% |
| Vanguard Balanced (60/40) | 7.88% | 10.27% | 0.60 | — | -30.22% |
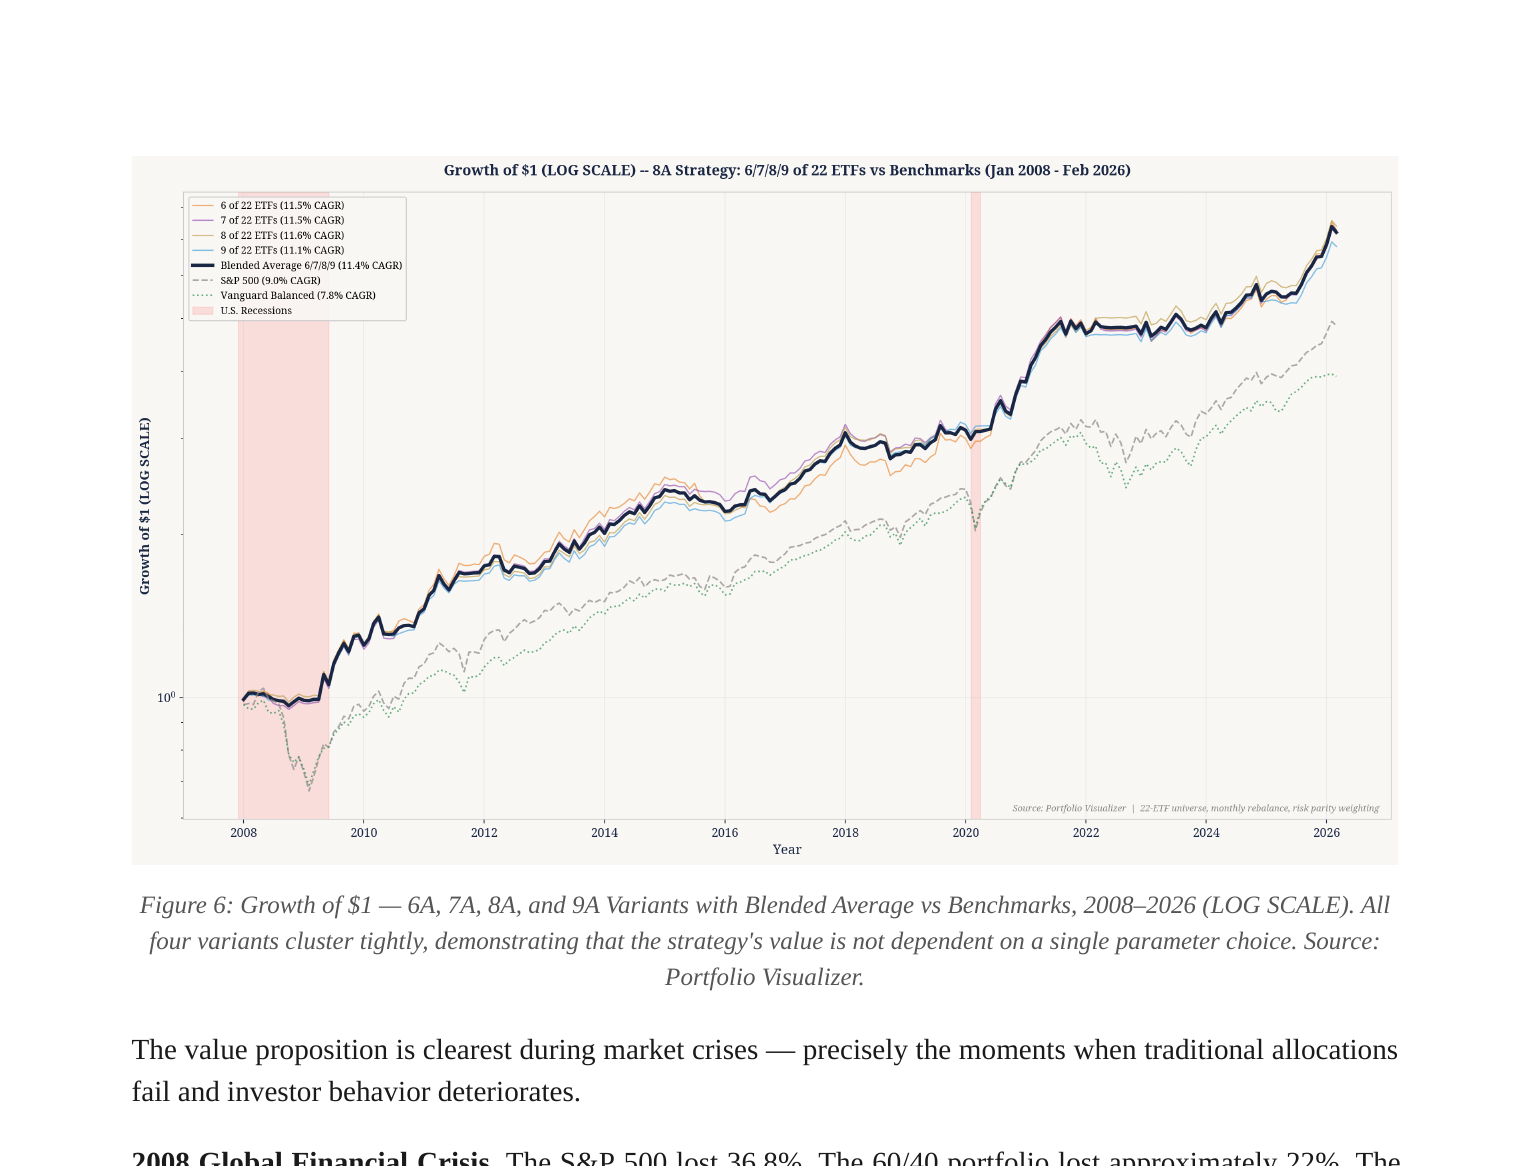
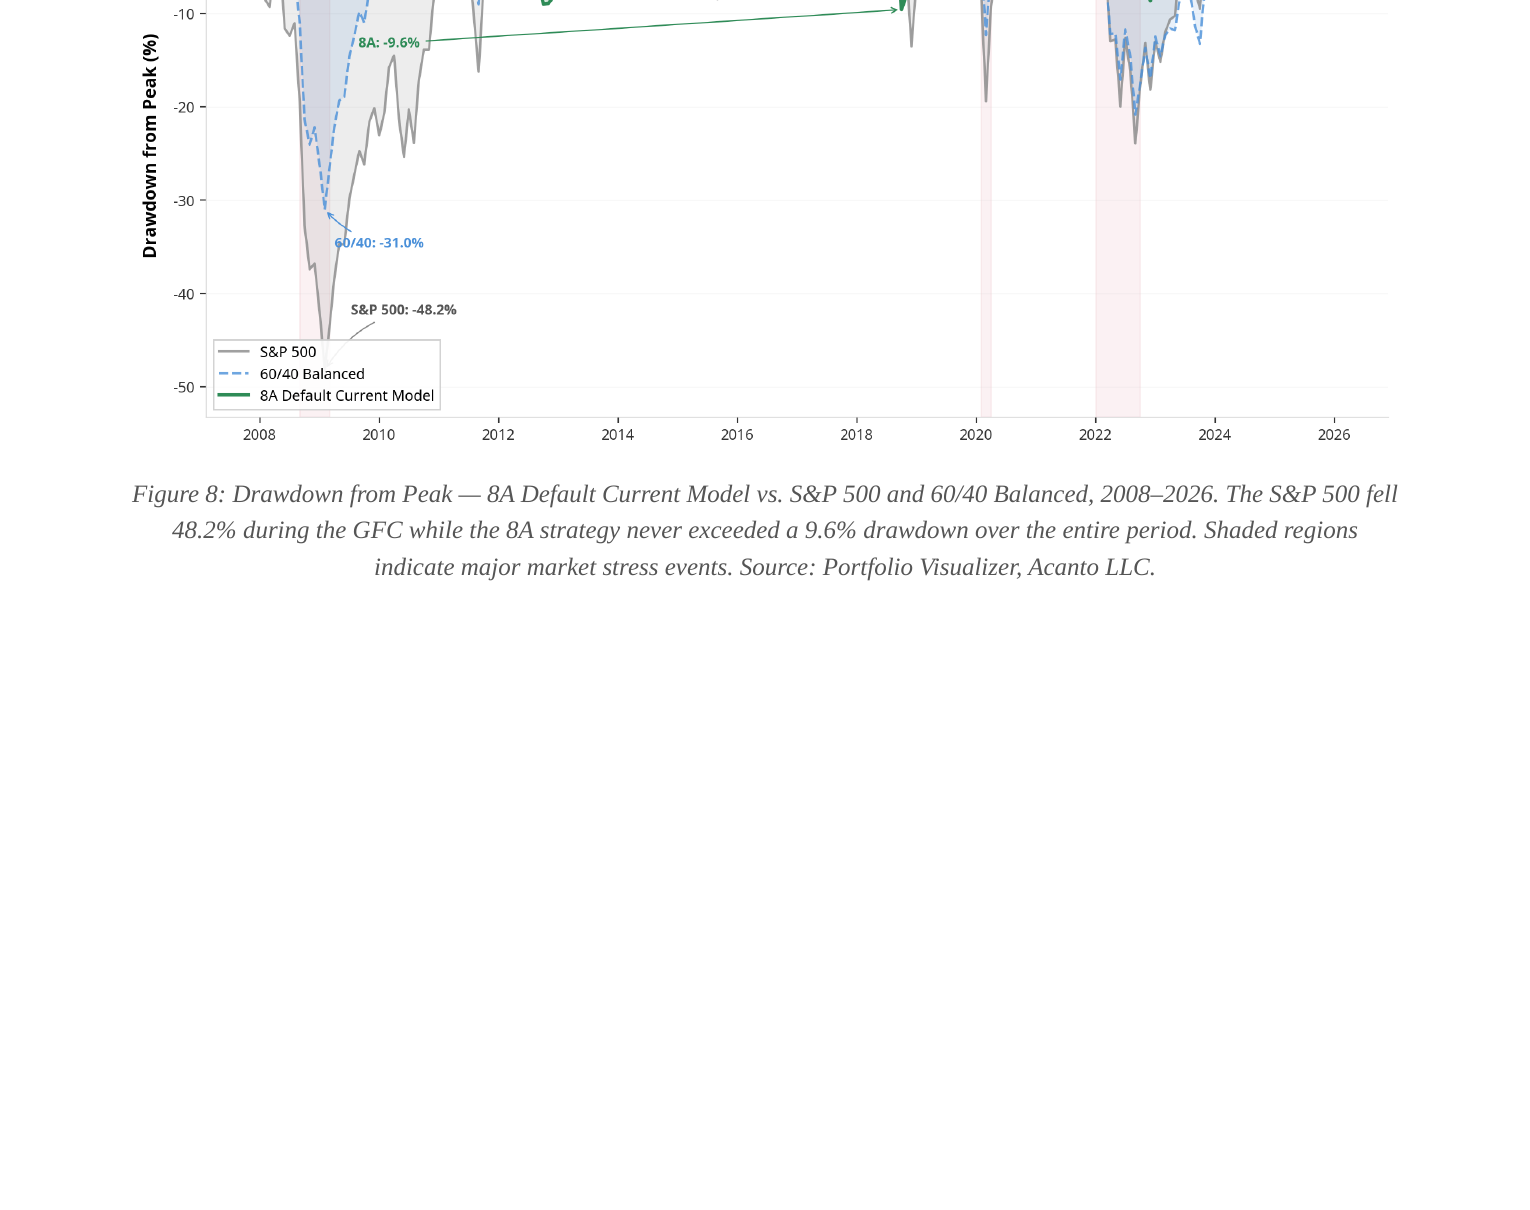
All four variants beat the S&P 500 on risk-adjusted return by a wide margin. All four cut maximum drawdown by 70–83% relative to the S&P 500. The variation across configurations is modest: CAGR ranges from 11.07% to 11.60%, Sharpe from 1.01 to 1.14.
Drawdown Protection During Crises
2008 Global Financial Crisis:The S&P 500 lost 36.8%. The 60/40 portfolio lost approximately 22%. The Acanto 8A strategy returned +4.7%, having rotated into long-term Treasury bonds and gold — not because it predicted the financial crisis, but because those assets had already begun outperforming as equities weakened.
2022 Rate Shock:Both stocks and bonds fell simultaneously — the S&P 500 lost 18.2% and TLT lost 30%. The Acanto 8A strategy limited its loss to −6.4% by rotating into cash equivalents (BIL, SHY), commodities (DBC), and energy (XLE).
How Adaptive Allocation Works
Momentum chooses the candidates. Risk parity sizes them intelligently. A naive approach would simply equal-weight the top-ranked assets. The problem is that a 12.5% allocation to short-term Treasuries (annualized volatility ~3%) contributes far less portfolio risk than a 12.5% allocation to silver (annualized volatility ~30%). Risk parity addresses this by weighting each position inversely proportional to its recent realized volatility.
Robustness: 4,228 Parameter Combinations
A common critique of quantitative strategies is that they are "curve-fit." To address this directly, the paper presents an exhaustive grid search testing 4,228 unique parameter combinations across four dimensions:
| Parameter | Range Tested | Variations |
|---|---|---|
| Universe Size | 5 to 21 assets | 17 |
| Holdings Count | 2 to 12 assets | 11 |
| Lookback Blends | 7 different schemes | 7 |
| Volatility Windows | 1, 2, 3, and 6 months | 4 |
The current Acanto 8A configuration ranks in the99th percentile for Sharpe Ratio,98th percentile for Sortino Ratio, and100th percentile for Alpha Sharpeamong all 4,228 tested models. It also ranks in the 2nd percentile for maximum drawdown — meaning only 2% of all tested configurations experienced a shallower worst decline.
The strategy is not sitting on a narrow peak. It occupies a wide plateau where many reasonable configurations produce strong risk-adjusted returns. Moving from 6 to 9 holdings changes CAGR by only 0.53 percentage points and Sharpe by only 0.13.
Conclusion: Adaptation Over Prediction
The central claim of this paper is modest. You do not need to predict the future to protect capital and generate competitive risk-adjusted returns. You need only a persistent coincidence — that assets which are currently outperforming tend to continue outperforming for one more month.
This coincidence has held across 154 years of asset class data spanning every conceivable economic regime. It has held across 39 years of mutual fund returns using plain-vanilla funds available in any retirement account. It has held across 4,228 parameter combinations, confirming that the result is structural rather than the product of a single optimized configuration.
"For the millions of investors whose retirement savings sit in static allocations designed for a world that may no longer exist, the question is not whether momentum rotation is perfect. The question is whether it is better than holding and hoping. One hundred and fifty-four years of evidence suggest that it is."
References
- Jegadeesh, N. and Titman, S. (1993). "Returns to Buying Winners and Selling Losers."The Journal of Finance, 48(1), 65–91.
- Asness, C., Moskowitz, T., and Pedersen, L. (2013). "Value and Momentum Everywhere."The Journal of Finance, 68(3), 929–985.
- Lusk, P. (2026). "Acanto's All Asset Adaptive 8: Momentum + Risk Parity." Acanto LLC White Paper.
- Kahneman, D. and Tversky, A. (1979). "Prospect Theory: An Analysis of Decision under Risk."Econometrica, 47(2), 263–291.
- Maillard, S., Roncalli, T., and Teïletche, J. (2010). "The Properties of Equally Weighted Risk Contribution Portfolios."The Journal of Portfolio Management, 36(4), 60–70.
- Shiller, R. Online Data — Robert Shiller. http://www.econ.yale.edu/~shiller/data.htm.
Download the full research paper:Persistent Coincidental Prediction: A Non-Predictive Framework for Mitigating Sequence of Returns Risk.
Download PDFImportant Research Disclosures and Risk Information
This document is published by Acanto LLC, a Registered Investment Advisor, for research and educational purposes only. It does not constitute investment advice, a solicitation, or an offer to buy or sell any security or investment product. Solicitation is only valid when accompanied by a current Form ADV Part 2A or equivalent regulatory filing.
Performance data presented herein is a blend of hypothetical backtested results and live performance, shown on a gross-of-fee basis. Hypothetical backtested performance has inherent limitations and does not represent actual trading. Real-time trading, advisory fees, transaction costs, taxes, and other factors may lead to performance that differs materially from the results shown. There is no guarantee that any strategy will achieve its investment objectives or avoid losses.
This strategy is not considered tax-efficient and may be most appropriate for implementation within a tax-qualified account. It is not suitable for all investors and should only be considered after a qualified financial advisor has reviewed the client's individual financial situation and determined that the strategy is appropriate.
The investment strategy and the systems used to manage it are subject to change or discontinuation at any time without notice. Prior to any investment, clients must receive and carefully review Acanto LLC's Form ADV Part 2A.
All investing involves risk, including the possible loss of principal. Past performance is no guarantee of future results.
© 2026 Acanto, LLC. All rights reserved.
Related Research
Better strategy starts with clarity.
Financial decisions should not be made in isolation. Acanto coordinates account structure, cash flow, taxes, insurance, estate planning, and adaptive investment management within one financial picture.
Continue the planning conversation
Explore Acanto's financial planning services and investment strategies to see how planning and portfolio decisions may be considered together for your individual circumstances.