Research Paper — Core Equity-Only Strategy
Equity Momentum Unpacked
A Systematic Framework for U.S. Stock Selection Using Blended Lookback Signals
A systematic equity momentum approach has historically compounded significantly faster than the S&P 500 across multiple market regimes. This result motivates the detailed construction and consistency analysis that follows.
Abstract
This paper documents the construction, validation, and consistency testing of a systematic equity momentum strategy applied to the largest 1,000 U.S. stocks by market capitalization. The strategy ranks stocks by a blended momentum score using 5-, 6-, and 10-month lookback windows, selects the top 20 names, and rebalances monthly with equal weighting. All results use daily price data with T+1 execution and 10 basis points of round-trip slippage. Over the October 1999 to December 2025 backtest period, the strategy delivered a 17.46% compound annual growth rate (CAGR) and a 0.70 Sharpe ratio, compared with 9.37% CAGR and 0.55 Sharpe for the S&P 500. Rolling out-of-sample validation across ten independent windows supports the configuration's consistency, with a 0.86 out-of-sample Sharpe ratio.
1. Introduction
Cross-sectional momentum, the tendency of recent winners to continue outperforming recent losers, is among the most extensively documented anomalies in empirical finance. Jegadeesh and Titman (1993) established the canonical 3-to-12-month formation period, and subsequent work by Asness, Moskowitz, and Pedersen (2013) demonstrated that the effect persists across asset classes and geographies.
Despite this well-established academic foundation, practical implementation requires several design choices that the literature leaves open: the exact lookback horizon, the number of holdings, the weighting scheme, the rebalancing frequency, and the treatment of transaction costs.
This paper addresses these implementation questions for a concentrated equity momentum portfolio. The strategy universe consists of the largest 1,000 U.S. stocks by market capitalization, reconstituted monthly on a point-in-time basis. The lookback configuration (5, 6, and 10 months) was selected through a structured process: an exhaustive in-sample grid search across 4,228 unique configurations, followed by rolling out-of-sample validation across ten independent windows, producing approximately 38,500 total validation runs.
2. Data and Methodology
Universe:The largest 1,000 U.S. common stocks by market capitalization, reconstituted monthly using point-in-time fundamental data. Stocks priced below $5.00 are excluded.
Momentum Signal:For each stock, the strategy computes three trailing total-return signals over 5, 6, and 10 calendar months. The composite momentum score is the equally weighted average. Stocks are ranked by composite score in descending order, and the top 20 are selected.
Portfolio Construction:20 stocks with equal weighting (5% each). Rebalancing occurs on the first trading day of each month using T+1 execution.
Transaction Costs:A flat 10 basis points of round-trip slippage is applied to all trades. Given the Top 1,000 universe (median market cap above $5 billion), this assumption is conservative relative to institutional execution costs.
3. Baseline Performance
| Strategy | CAGR | Sharpe | Sortino | Vol | Max DD | Total Return |
|---|---|---|---|---|---|---|
| EQM 5/6/10 | 17.46% | 0.70 | 1.23 | 29.01% | -63.47% | 6,728% |
| EQM 3/4/5/6 | 14.48% | 0.61 | 1.04 | 29.04% | -74.01% | 3,543% |
| EQM 6/9/12 | 14.32% | 0.62 | 1.01 | 27.82% | -64.35% | 3,182% |
| EQM 6/12 | 13.66% | 0.60 | 0.97 | 27.88% | -65.83% | 2,719% |
| SPY | 9.37% | 0.55 | 0.65 | 19.89% | -55.19% | 692% |
| Top 1000 EW | 8.53% | 0.56 | 0.51 | 17.50% | -53.80% | 757% |
Table 1: All series October 1999 through December 2025. Source: Acanto v3 Engine.
The 5/6/10 configuration delivers the highest CAGR (17.46%), the highest Sharpe ratio among momentum variants (0.70), and the highest Sortino ratio (1.23). Against its own universe benchmark (Top 1000 EW), the strategy delivers nearly 9 percentage points of excess CAGR, suggesting that the momentum signal, not the universe composition, drives the return premium.
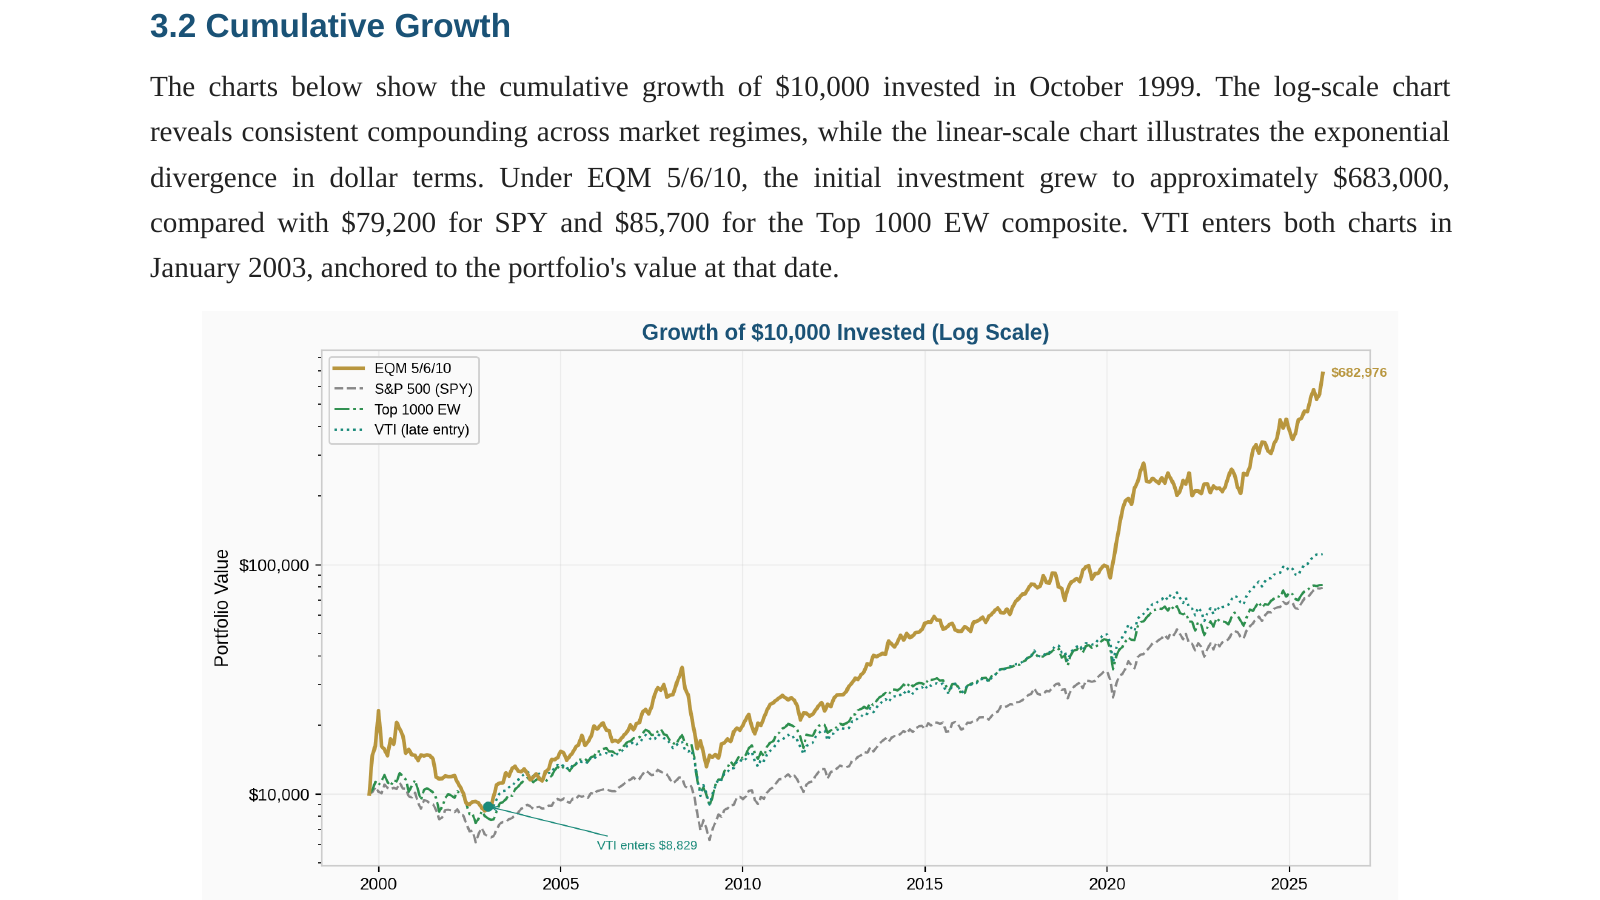
Under EQM 5/6/10, an initial $10,000 investment grew to approximately $683,000, compared with $79,200 for SPY and $85,700 for the Top 1000 EW composite. The strategy produced positive calendar-year returns in 20 of 26 years (77% win rate).
4. Drawdown Profile
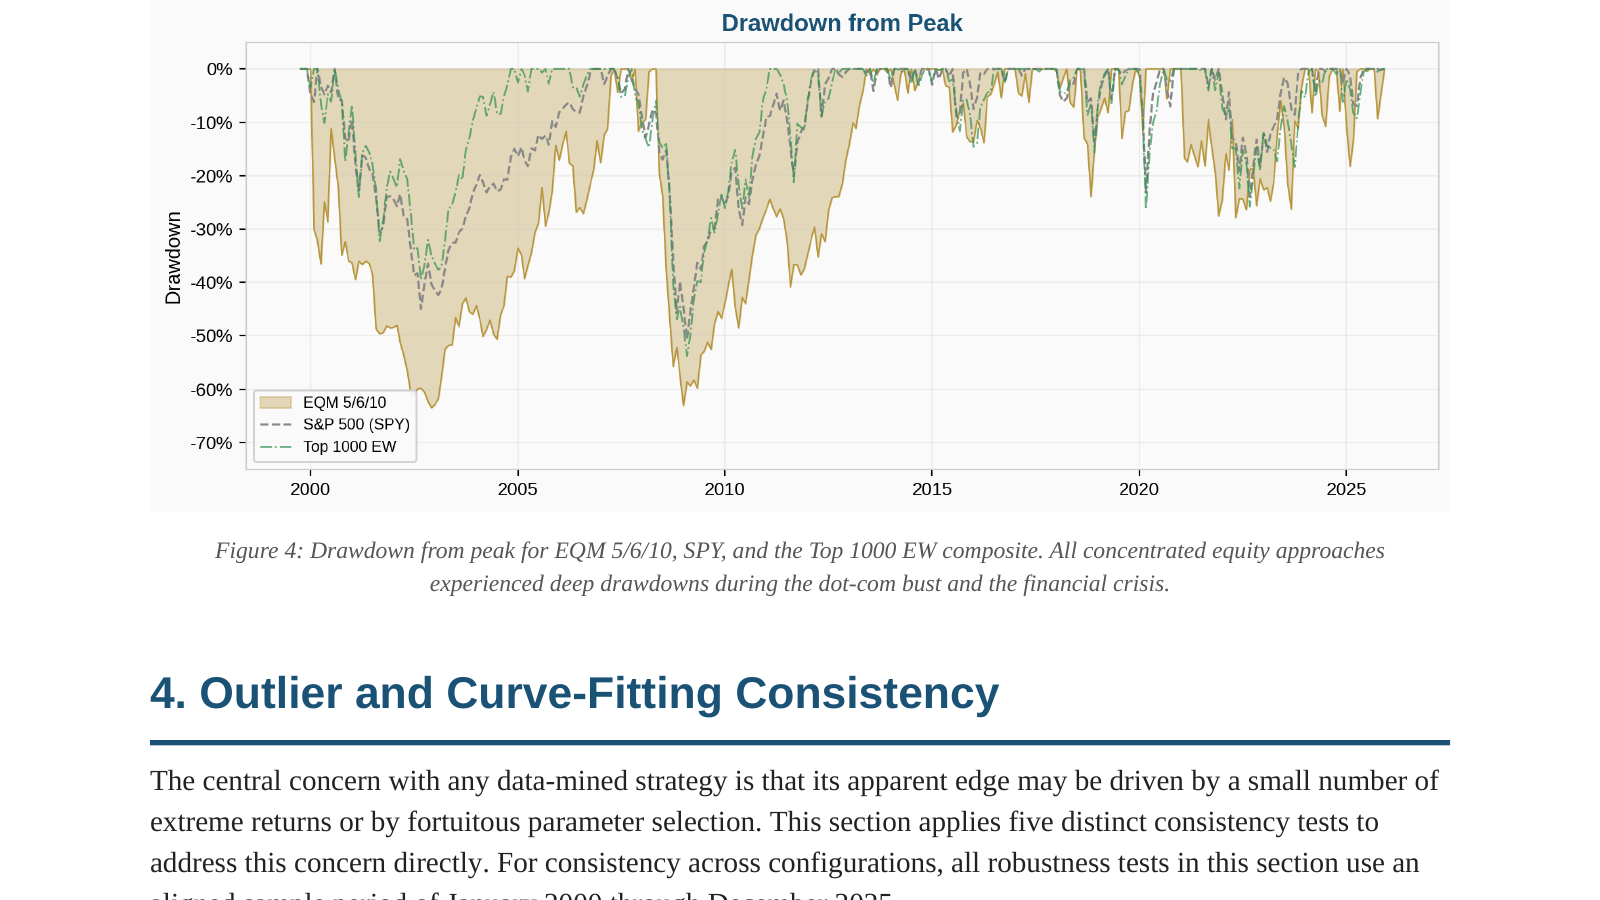
The strategy's maximum drawdown of -63.47% occurred during the 2008-2009 financial crisis, approximately 8 percentage points deeper than SPY's -55.19%. This reflects the higher volatility inherent in a 20-stock concentrated portfolio.
However, the strategy recovered approximately three years faster: it regained its prior peak by mid-2010, while SPY did not fully recover until early 2013. At each monthly rebalance, momentum rotation exits names whose relative strength has deteriorated and reallocates to those gaining strength. This monthly self-correction compresses the time spent underwater even when the initial drawdown is deeper.
5. Outlier and Curve-Fitting Consistency
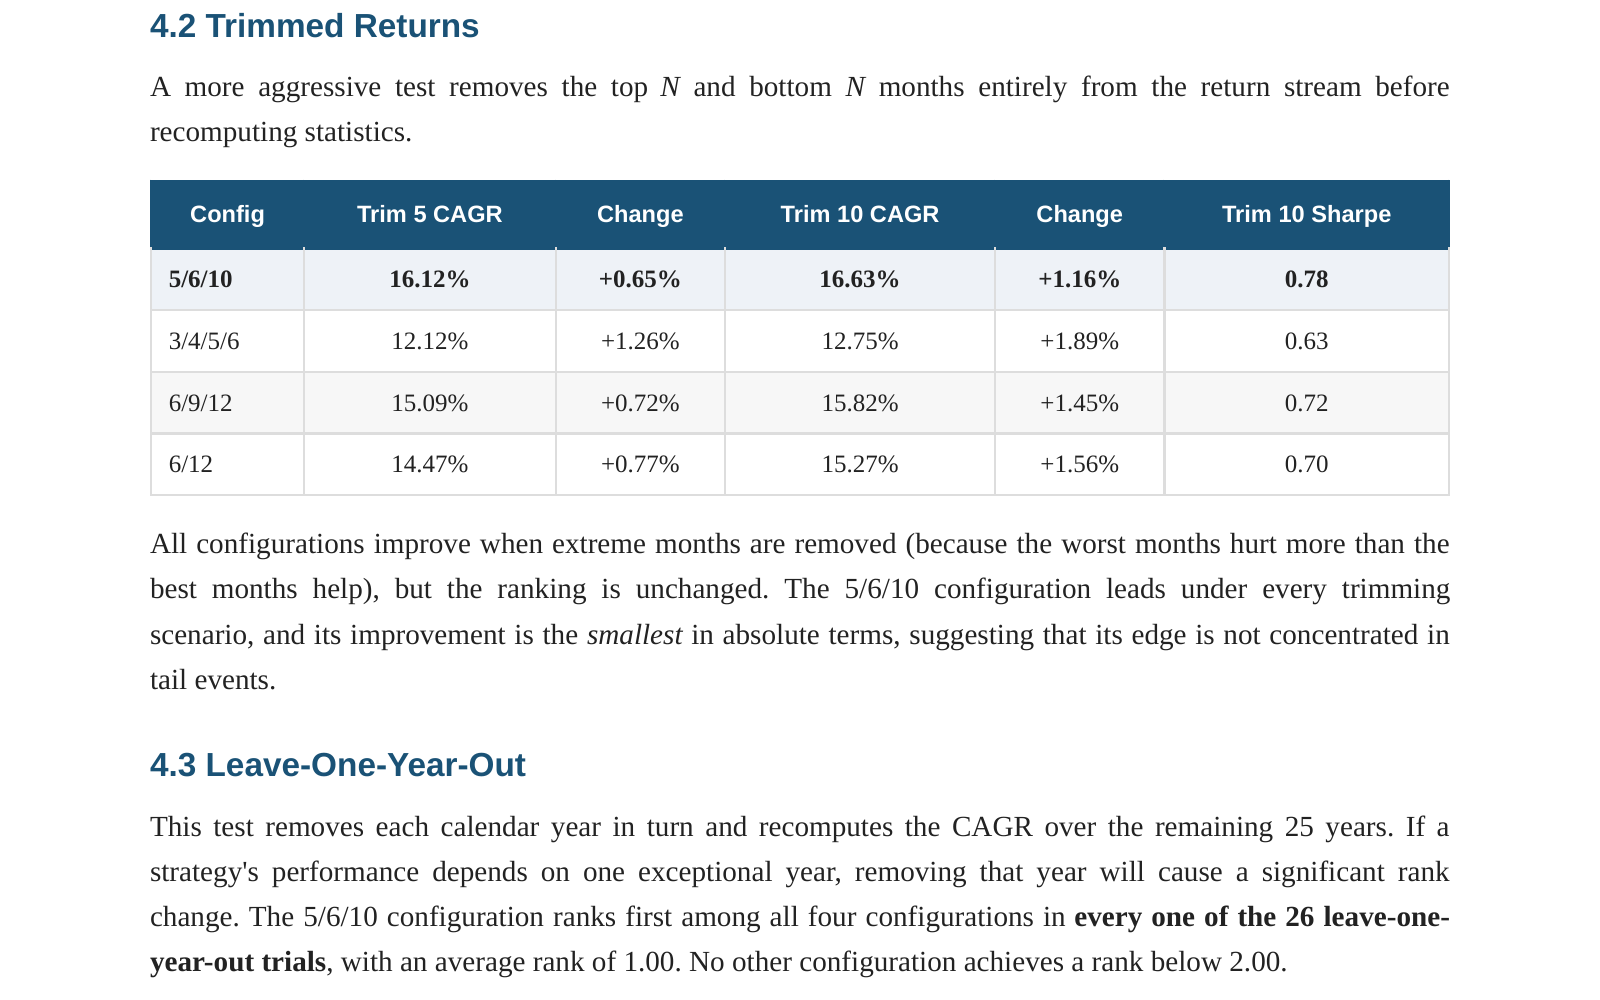
Winsorized Returns:The 5/6/10 configuration is the least affected by winsorizing: its CAGR increases by 7 basis points after symmetric 1st/99th percentile capping, confirming the strategy is not dependent on lucky positive outliers.
Leave-One-Year-Out:The 5/6/10 configuration ranks first among all four configurations in every one of the 26 leave-one-year-out trials, with an average rank of 1.00.
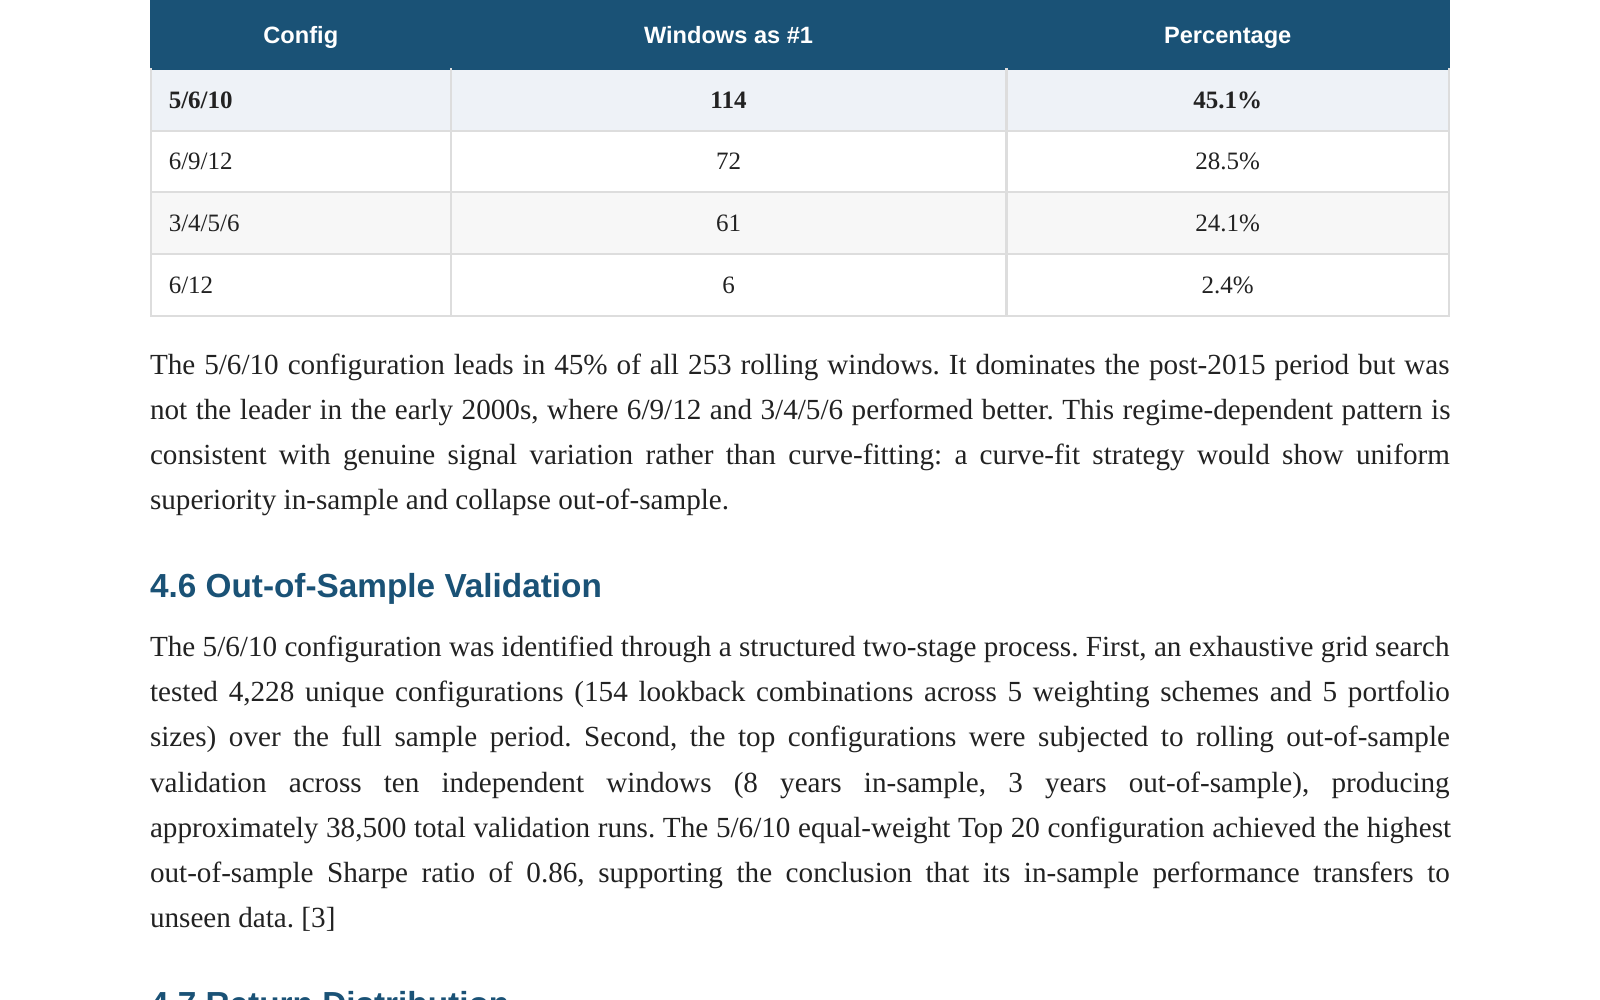
Rolling 5-Year Sharpe:The 5/6/10 configuration leads in 45% of all 253 rolling windows. It dominates the post-2015 period but was not the leader in the early 2000s, where 6/9/12 and 3/4/5/6 performed better. This regime-dependent pattern is consistent with genuine signal variation rather than curve-fitting.
Out-of-Sample Validation:The configuration was identified through a structured two-stage process testing 4,228 unique configurations across approximately 38,500 total validation runs. The 5/6/10 equal-weight Top 20 configuration achieved the highest out-of-sample Sharpe ratio of 0.86.
6. Sector Allocation Over Time
Technology has been the dominant allocation in recent years, consistent with the sector's strong momentum since 2016. Earlier periods show meaningful allocations to Energy (2004-2008), Healthcare, and Consumer Cyclical sectors.
In 2000-2002, the portfolio shifted heavily out of Technology and into Basic Materials and Consumer Cyclical names as the dot-com bubble unwound. This dynamic rotation is a structural advantage of cross-sectional momentum: the portfolio adapts to the prevailing market narrative without requiring any discretionary judgment or macro forecasting.
7. Practical Considerations
Turnover:The strategy replaces approximately 7 to 8 of its 20 holdings each month, implying annual two-sided turnover of approximately 440%. At the assumed 10 basis points per round trip, annual transaction costs are approximately 22 basis points.
Tax Considerations:The strategy's high turnover generates primarily short-term capital gains, making it best suited for tax-advantaged accounts (IRAs, Roth accounts). In taxable accounts, the after-tax return will be materially lower.
Blending:Prior analysis has shown that a 70/30 allocation between a tactical all-asset strategy (such as the Adaptive 8A) and the EQM equity momentum strategy is Sharpe-optimal for a combined portfolio. The low correlation between cross-asset momentum and equity-only momentum provides meaningful diversification.
8. Conclusion
The 5/6/10 equal-weight equity momentum strategy applied to the Top 1,000 U.S. stocks delivers a meaningful return premium over passive benchmarks with a Sharpe ratio that is competitive on a risk-adjusted basis. Five independent consistency tests support the view that the strategy's performance is not driven by outlier returns or parameter overfitting.
The strategy's primary limitation is its deep drawdown during equity bear markets, which is an inherent feature of any long-only concentrated equity portfolio. Investors should size the allocation appropriately and consider blending with lower-volatility strategies to manage portfolio-level risk.
Important Research Disclosures and Risk Information
This paper is intended solely for informational, educational, and research purposes. It does not constitute investment advice, a solicitation, or an offer to buy or sell any security or investment product. Any solicitation of investment management services by Acanto, LLC is valid only when accompanied by a current Form ADV Part 2 or equivalent regulatory disclosure document. Acanto, LLC reserves the right to modify, change, or discontinue any or all parts of the described strategy at any time without prior notice.
Past Performance Disclosure.All performance data presented in this paper, including backtested results, are provided for informational purposes only. Past performance is not a guarantee, prediction, or indication of future results. An investor may experience a loss of some or all of the principal invested.
Backtesting Limitations.Backtested performance results have inherent limitations and are hypothetical in nature. They do not represent actual trading. Actual results will differ, potentially materially, from the backtested results shown.
Risk of Loss.All investing involves risk, including the possible loss of principal. The strategy involves concentrated equity positions and monthly rebalancing, which may result in higher portfolio turnover. The strategy is not appropriate for all investors.
Conflict of Interest.Peter Lusk, Jr., the author, is the co-founder and Chief Investment Officer of Acanto, LLC, which commercially manages client assets using the strategy described herein.
Peter Lusk, Jr., MBA, CMT
Co-Founder & Chief Investment Officer, Acanto LLC
Support@acantollc.com | (914) 714-0735
Continue the planning conversation
Explore Acanto's financial planning services and investment strategies to see how planning and portfolio decisions may be considered together for your individual circumstances.